
Please check my task
The graph compares the proportion of small, medium and large groups of Australian companies which used social media for business reasons from 2012 to 2016.
Overall, large companies used social media than other groups. Moreover, in 2015, the figures fell for all groups.
In 2012, the figure for small companies was approxiamately 30% while the percentage of medium companies was over 30%. In contrast, the proportion of large companies was more doubled, stood at 80%. The following year, both small and large companies witness little change whereas medium companies experienced significant growth, stood at just under 50%. In 2014, the figure for small and medium companies increased to 39% and 49% respectively while there was a decrease in the figure for large companies.
However, in 2015, there was a decline in the use of social media by all groups, approxiamately at 30% and 50% by large companies. In contrast, the figures for 2016 increased to 49% and 55% for small and medium companies, respectively. Moreover the proportion of large companies also raised to 80%, returning to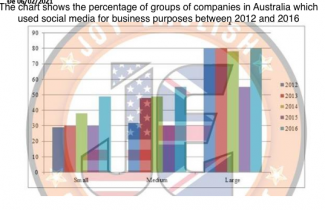
their levels of 2012 and 2013.
Top answer
That image is too small. Can you attach a large clear version please?
- That image is too small.
- Can you attach a large clear version please?
Get the Weekly English Kit 📬
New words, one handy idiom, and a 2-minute quiz — delivered to your inbox to keep your streak alive.
That image is too small. Can you attach a large clear version please?
 Related Questions