
Please check my task 1 essay. Thank you!
The three pie charts below show the changes in annual spending by a particular UK school in 1981, 1991 and 2001. Summarise the information by selecting and reporting the main features, and make comparisons where relevant.
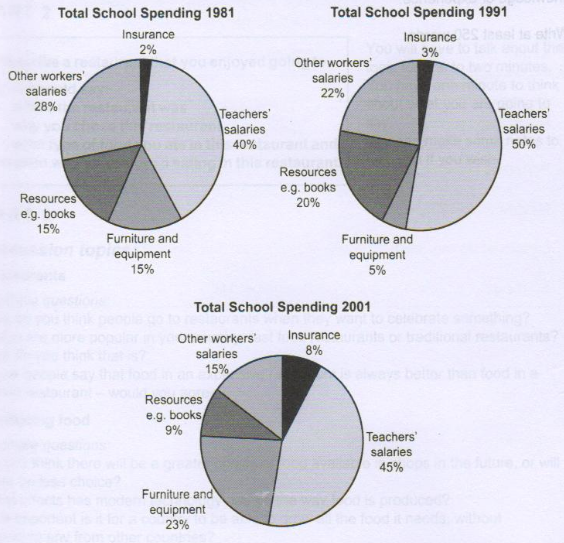
The three pie charts compare the percentage of money a UK school spent on five different categories each year, namely: teacher's salaries, furniture and equipment, resources, insurance and other workers' salaries in the years 1981, 1991 and 2001.
Overall, the highest proportion of spending went to tutors' salaries whereas insurance was paid the least. There were slight changes in spending on furniture and equipment, resources and other workers' salaries.
In 1981, teachers' salaries were accounted for 40%. It increased by 10% after one decade before falling to 45% in 2001. In contrast, there were sharp drops in the expenditure of other employees' salaries, from 28% to 22% to 15% in 1981, 1991 and 2001 respectively.
On the other hand, the fund for furniture and equipment comprised 15% in 1981 but then declined by 10% ten years later. However, it rose significantly to 23% in 2001. The total percentage devoted to resources showed an initial increase from 15% to 20% in 1991 then dropped by 11%, as opposed to insurance, which increased steadily, from just 2% in 1981 to 8% in 2001.
(181 words)
Thank you for helping out!
Top answer
The three pie charts compare the percentage of total expenditures money a UK school spent on five different categories each year, namely: teacher's salaries, furniture and equipment, resources, insurance and other workers' salaries in the years 1981, 1991 and 2001. Overall, the highest proportion of spending went to tutors ' salaries whereas insurance was paid the least. There were slight changes in spending on furniture and equipment, resources and other workers' salaries.
- The three pie charts compare the percentage of total expenditures money a UK school spent on five different categories each year, namely: teacher's salaries, furniture and equipment, resources, insurance and other workers' salaries in the years 1981, 1991 and 2001.
- Overall, the highest proportion of spending went to tutors ' salaries whereas insurance was paid the least.
- There were slight changes in spending on furniture and equipment, resources and other workers' salaries.
- In 1981, teachers' salaries were accounted for 40%.
- It increased by 10% after one decade before falling to 45% in 2001.
Get the Weekly English Kit 📬
New words, one handy idiom, and a 2-minute quiz — delivered to your inbox to keep your streak alive.
The three pie charts compare the percentage of total expenditures money a UK school spent on five different categories each year, namely: teacher's salaries, furniture and equipment, resources, insurance and other workers' salaries in the years 1981, 1991 and 2001.
Overall, the highest proportion of spending went to
Sample essay. This essay is too long, but it will give you something to study.
You must combine categories together to get a high band score.
Vocabulary:
nondiscretionary spending - these are the items that you nave to spend money on, such as accommodation, utilities and food. For a school, it must pay salaries and insurance.
discretionary
 Related Questions