
Please check my task 1 essay
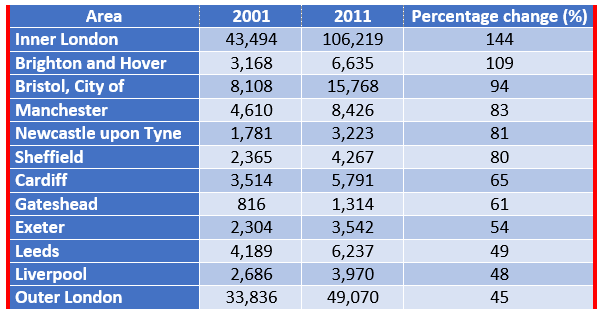
The table compares the number of people who cycled to work in twelve UK areas in the years 2001 and 2011.
Overall, the figures for all areas were similar in terms of increase. While Inner London had by far the highest number of commuters those who traveled to work by cycles in both years.
In 2001, there were 43491 of UK residents who commuted to work by cycle. After a decade, the number rose significantly to 106219 people, an increase of 144%. In the same period of 10 years, although Outer London had the second highest number of residents who cycled to work, there was only 45% of rising from 338236 to 49070 numbers of people went to work by cycles.
While the figures for Bristol city had steadily increased by over 7500 from 8108 people. Besides that, the numbers for remainder nine areas were all increased from 800 to approximately 6700 people in both years.
Top answer
The table compares the number of people who cycled to work in twelve UK areas in the UK in the years 2001 and 2011. Overall, the figures for all areas were similar in terms of increase, increase. While while i nner London had by far the highest number of commuters those who traveled to work by bi cycl e in both years.
- The table compares the number of people who cycled to work in twelve UK areas in the UK in the years 2001 and 2011.
- Overall, the figures for all areas were similar in terms of increase, increase.
- While while i nner London had by far the highest number of commuters those who traveled to work by bi cycl e in both years.
- In 2001, there were 4 3, 49 4 of UK residents of inner London who commuted to work by bi cycle.
- After a decade, the that number rose significantly to 10 6, 219 people, an increase of 144%.
Get the Weekly English Kit 📬
New words, one handy idiom, and a 2-minute quiz — delivered to your inbox to keep your streak alive.
The table compares the number of people who cycled to work in twelve UK areas in the UK in the years 2001 and 2011.
Overall, the figures for all areas were similar in terms of increase, increase. While while
 Related Questions