
Please Check My Ilets Task 1
QUESTION:
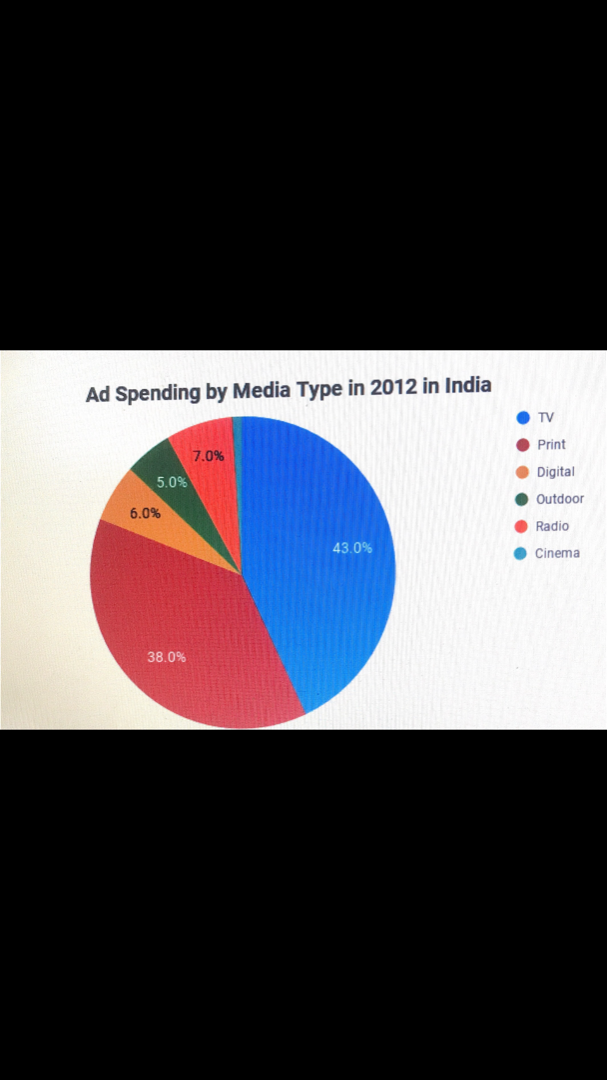
The pie chart below shows the percentage of ad spending by different kinds of media in India from 2012 to 2017.
Summarise the information by selecting and reporting the main features, and make comparisons where relevant.
Write at least 150 words.
The two pie charts compare the ad spending by 6 different types (TV, print, digital, outdoor, radio and cinema) of media in India in 2012 and 2017.
Overall, TV and printed sources consumed a considerable portion among the types, ad spending on digital and over the radio rose marginally. Whereas outdoor and cinema type remained static.
In 2012, TV and printed forms of ad had more than three quarters spending together, however 2017 saw a growth in ads on TV by 2%. On the other hand printed ads from 38% experienced a considerable decline of 8% by 2017.
Among the remaining types of media digital grew drastically from 6% to peak of 15% over the period accounting for the maximum growth experienced. For radio, from 7% in 2012 to a drop of 3% over the years. Ad spending by media on Outdoor and cinema saw no changes through the period.
Top answer
1. There is no pie chart for 2017, so I cannot properly evaluate the essay. 2.
- 1.
- There is no pie chart for 2017, so I cannot properly evaluate the essay.
- 2.
- The instructions are poor English.
- The preposition "by" is not used correctly.
Get the Weekly English Kit 📬
New words, one handy idiom, and a 2-minute quiz — delivered to your inbox to keep your streak alive.
1. There is no pie chart for 2017, so I cannot properly evaluate the essay.
2. The instructions are poor English. The preposition "by" is not used correctly. The people who wrote this task are not native speakers.
The pie charts break down total advertisement spending by companies on six different media types.
Companies pay to advertise on media.
 Related Questions