
Please check my Ielts Writing Task 1, Thanks
The given line chart demonstrated how many cars were driven by British families between 1971 and 2007.
As can be clearly seen from the chart, the number of the United Kingdom families didn’t use car declined extensively. Whereas, there was substantial upward trend in the number of British families with two cars.
In the period of 36 years starting from 1971, more and more British families used two cars. It increased nearly to 30% closely from 10%. While, the number of families with no car decreased by half. It reached its bottom at 25%. In 2003, the number of British families in each group occupied one fourth in the total of households.
Over the period of 36 years, the total of families in British with one car remained stable. From 1971 to 1979, the number of the UK families with three or more cars had remain its stability and then it continued a slight rise to 8%.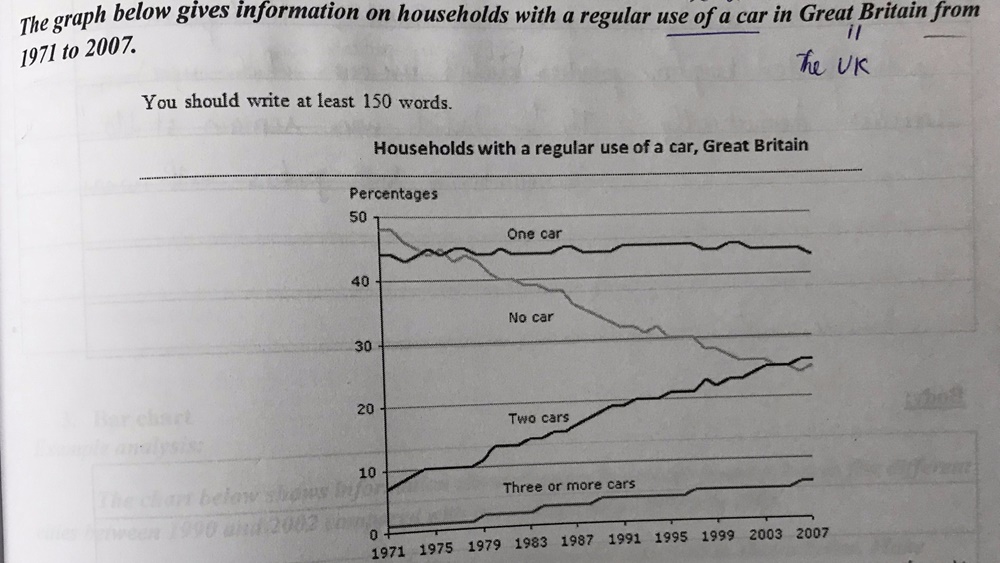
Top answer
The given line chart demonstrate s how many cars were driven by British families between 1971 and 2007. As can be clearly seen from the chart, the number of the United Kingdom families (missing word) didn’t use car declined extensively . (wrong word) Whereas , there was substantial upward trend in the number of British families with two cars.
- The given line chart demonstrate s how many cars were driven by British families between 1971 and 2007.
- As can be clearly seen from the chart, the number of the United Kingdom families (missing word) didn’t use car declined extensively .
- (wrong word) Whereas , there was substantial upward trend in the number of British families with two cars.
- In the period of 36 years starting from 1971, more and more British families used two cars.
- It increased nearly to 30% closely from 10%.
Get the Weekly English Kit 📬
New words, one handy idiom, and a 2-minute quiz — delivered to your inbox to keep your streak alive.
The given line chart demonstrates how many cars were driven by British families between 1971 and 2007.
As can be clearly seen from the chart, the number of the United Kingdom families (missing word) didn’t use car declined extensively. (wrong word) Whereas, there
 Related Questions