
Please check my IELTS Writing task 1. Thank you very much!
Topic: The table below gives information on consumer spending on different items in five different countries in 2002.
Summarise the information by selecting and reporting the main features and make comparison where relevant.
My essay: 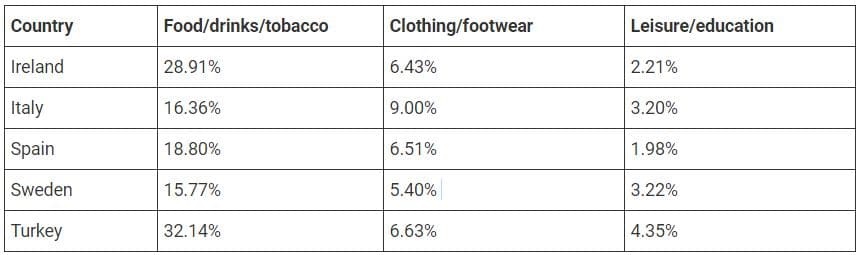
The table illustrates the percentage of spending customers for three different categories in five nations in 2002.
Overall, it is clear that the demand for food/ drinks/ tobacco is necessary for people, which are presented in the table with the highest spending percentages. On the other hand, leisure/ education is just paid less attention because people who come from five countries spent the least money on that.
Out of five countries, well under a third of spending on food/drinks/tobacco was from people in Turkey, followed by Ireland, with nearly 29%. Similarly, Turkey had also the highest percentage in the leisure/education expenditure, at 4.35%, whereas there was an opposite pattern that can be seen in Spain, at just 1.98%.
Comparison to other countries, citizens of Sweden just spent the smallest money on food/ drinks/ tobacco and clothing/ footwear, with 15.77% and 5.40%, respectively. Another point is noticeable that Italian paid the largest money for clothing/ footwear among countries.
Top answer
The table illustrates (poor word choice) the percentage of spending customers (wrong phrase) for three different categories in five nations in 2002. (Incomplete. What are the nations?
- The table illustrates (poor word choice) the percentage of spending customers (wrong phrase) for three different categories in five nations in 2002.
- (Incomplete.
- What are the nations?
- ) Overall , it is clear that the demand for food/ drinks/ tobacco is necessary for people, (Do not write conclusions or inferences in Task 1.
- The purpose of Task 1 is to describe the information in a figure or table to a math or science professor.
Get the Weekly English Kit 📬
New words, one handy idiom, and a 2-minute quiz — delivered to your inbox to keep your streak alive.
The table illustrates (poor word choice) the percentage of spending customers (wrong phrase) for three different categories in five nations in 2002. (Incomplete. What are the nations? What are the categories?)
Overall, it is clea
 Related Questions