
Please check my IELTS Writing Task 1. Thank you!
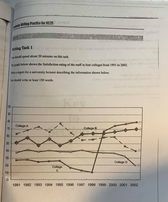
The line graph compares four sectors in the satisfaction percentage of the staff that studied over a period of 12 years.
It clears to see that the amount of satisfaction rating fluctuated erratically in almost all colleges. The most change was seen in College C whereas College D was in contrast with a lower frequency.
In 1991, around 65% of satisfaction ratings came from College A and 50% was the start number of College B. These sectors had a significant fluctuation from 1991 to 1996, before intersecting in 1997 with 60%. After that, College A decreased steadily as opposed to a gradual rise of College B over the last six years.
There was an obvious decline in the percentage of College C in the first eight years, suddenly bounced to approximately 70% just one year later and continuously rose, while College D did not record much more changes like the former that maintained the downward trend in all period.
Thank you so much!
Top answer
Sorry, but that image is so small and blurry, I cannot read it. Please read my advice for Task 1. It covers many vocabulary errors that students make.
- Sorry, but that image is so small and blurry, I cannot read it.
- Please read my advice for Task 1.
- It covers many vocabulary errors that students make.
- IELTS TASK 1: Hints, Tips And Advice Vocabulary Words For Task 1: Reference Post
Get the Weekly English Kit 📬
New words, one handy idiom, and a 2-minute quiz — delivered to your inbox to keep your streak alive.
Sorry, but that image is so small and blurry, I cannot read it.
Please read my advice for Task 1. It covers many vocabulary errors that students make.
 Related Questions