
Please check my IELTS Writing task 1-Bar
Dear teacher,
Please check my IELTS Writing task 1-Bar.
Thank you,
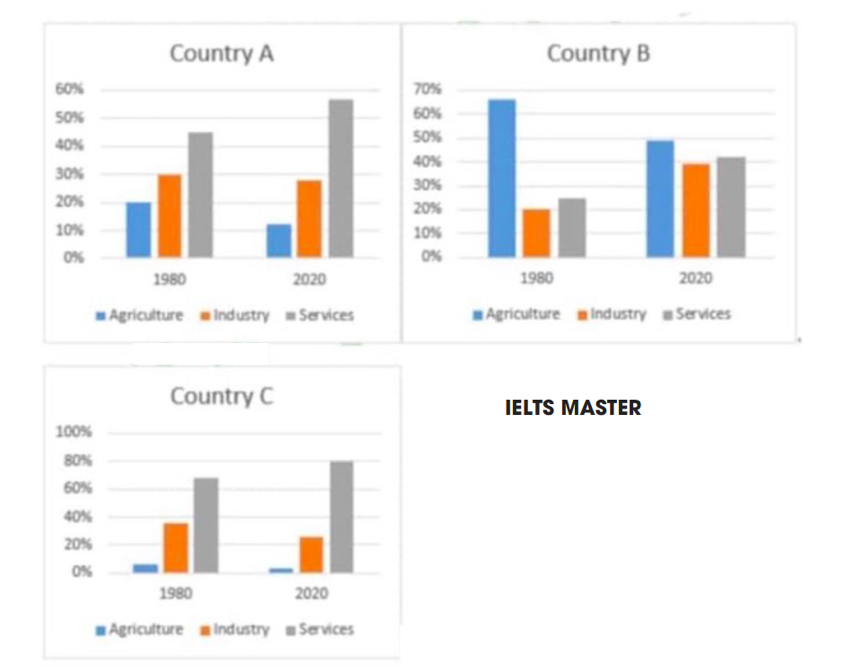
Task 1: the charts show the distribution(s? phân ph?i) of employment among agriculture, industry(CN) and service in three country in 1980 and 2020
The bar charts compare three different nations in term of employment distribution rate about agriculture, industry and service in 1980 and 2020.
Overall, it is clear that the figure for service are much higher than those for agriculture and industry among 2 countries A and C is except to B country with agriculture show the highest rate of job distribution.
In 1980, agriculture accounted for the highest rate about 65% in A nation compared to 20% and 5% in countries A, C respectively. During the same period, the figures for service was also highest in A country, at 45% and C country, at around 70% while significant lower in B country, at 25%. By contrast, industry percentage remained below 40% among 3 nations in the following year.
Looking into the future, service rate is predicted for countries A and C will remain stable the highest position at around 58% and 80% respectively for 40 years. In addition, it thought that 50% of agriculture in country B will account for the highest rate by 2020, whereas industry percentage will be slightly lower, at about 30% in A, C nations and 40% in B nation of total 100%.
Top answer
Dear teacher, please help me.
- Dear teacher, please help me.
Get the Weekly English Kit 📬
New words, one handy idiom, and a 2-minute quiz — delivered to your inbox to keep your streak alive.
Task 1: the charts show the distribution (s? phân ph?i) of employment among agriculture, industry (CN) and services in three countries in 1980 and 2020.
-----------------------------------------------------------------
 Related Questions