
Please check my IELTS Writing Task 1
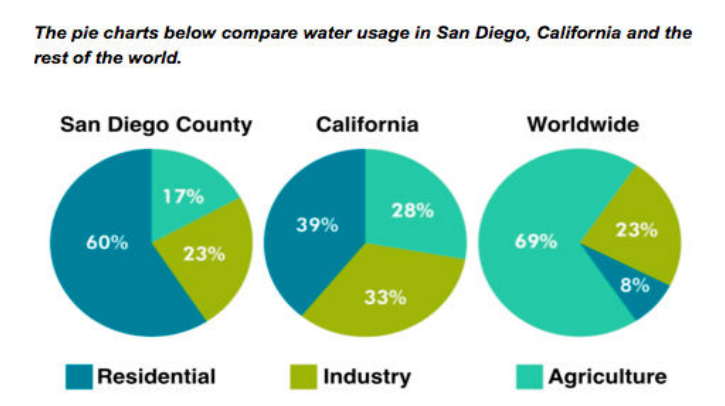
The pie charts compare water consumption in terms of residential, industry, and agriculture in San Diego, California, and the rest of the world.
It is noticeable that the use of water for homes in San Diego and California is higher than in the rest of the world, whereas the substantial majority of water is consumed for agriculture in numerous places in the world.
Looking at the chart, in San Diego and California, water is mainly used for residential, constituting 60% and 39%. By contrast, only 8% of water is globally consumed by homes. However, this pattern is reversed for agriculture’s water usage. This accounts for a massive 69% of global water consumption, but only 17% and 23% are used in San Diego and California respectively.
With regard to water usage for industry, the figures are similar to each other. The same proportion of water (23%) is consumed in San Diego and worldwide, while the amount for California is 10% higher, at 33%.
Top answer
The pie charts compare water consumption in terms of residential, industr ial , and agricultu r al use in San Diego, California, and the rest of the world. It is noticeable that the use of water for homes in San Diego and California is higher than in the rest of the world, whereas the substantial vast majority of water is consumed for used for agriculture in numerous various places in the world. [ ] Looking at the chart, I n San Diego and the rest of California, residential use of water is mainly used for residential, constituting constitutes 60% and 39% of the total respectively .
- The pie charts compare water consumption in terms of residential, industr ial , and agricultu r al use in San Diego, California, and the rest of the world.
- It is noticeable that the use of water for homes in San Diego and California is higher than in the rest of the world, whereas the substantial vast majority of water is consumed for used for agriculture in numerous various places in the world.
- [ ] Looking at the chart, I n San Diego and the rest of California, residential use of water is mainly used for residential, constituting constitutes 60% and 39% of the total respectively .
- By contrast, only 8% of water is globally consumed by homes.
- However, this pattern is reversed for agricultur e, ’s water usage.
Get the Weekly English Kit 📬
New words, one handy idiom, and a 2-minute quiz — delivered to your inbox to keep your streak alive.
The pie charts compare water consumption in terms of residential, industrial, and agricultural use in San Diego, California, and the rest of the world.
It is noticeable that the use of water for homes in San Diego and California is higher than in the re
 Related Questions