
PLEASE CHECK MY IELTS WRITING TASK 1
Topic:
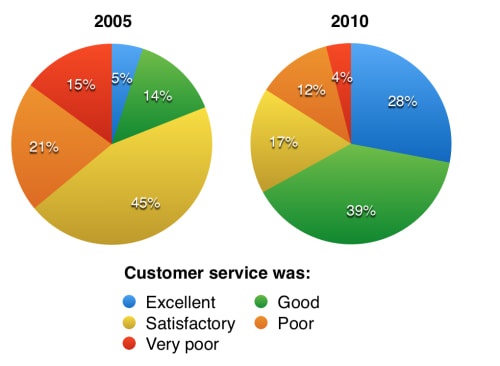
The charts below show the results of a questionnaire that asked visitors to the Parkway Hotel how they rated the hotel's customer service. The same questionnaire was given to 100 guests in the years 2005 and 2010.
Summarise the information by selecting and reporting the main features and make comparisons where relevant.
Essay:
The pie charts illustrate how Parkaway Hotel's guests were satisfied with the customer service by giving questionnaires to 100 visitors between 2005 and 2010.
Overall, most people rated the service as satisfactory in 2005 but in 2010, the proportion of people who gave good feedback was the highest. In addition, the percentage of people with positive remarks increased significantly.
In 2005 nearly a half of guests were satisfied with the service, after which this figure declined to 17% 5 years later. In contrast, although only 14% of guests rated the service as good in the initial year, this figure climbed by 25% in 2010. Meanwhile, the percentage of people who thought the service was excellent showed a dramatic growth , rising from purely 5% to 28%.
The negative feedback became less common over time. In 2005, the proportion of people with poor and very poor ratings accounted for 21% and 15% respectively. However, in 2010, only 4% and 12% of people stuck with these ratings.
Top answer
Please read my advice for Task 1 essays: IELTS TASK 1: Hints, Tips And Advice Vocabulary Words For Task 1: Refere nce
- Please read my advice for Task 1 essays: IELTS TASK 1: Hints, Tips And Advice Vocabulary Words For Task 1: Refere nce
Get the Weekly English Kit 📬
New words, one handy idiom, and a 2-minute quiz — delivered to your inbox to keep your streak alive.
The pie charts illustrate (wrong verb) how Parkaway Hotel's guests were satisfied with the customer service by giving questionnaires to 100 visitors between 2005 and 2010. (That does not make sense. Did they give questionnaires in 2006, 2007 an
 Related Questions