
Please check my IELTS Task 1 writing
Hi
Please check this essay for me.
The graph below shows the proportion of four different materials that were recycled from 1982 to 2010 in a particular country.
Summarize the information by selecting and reporting the main features, and make comparisons where relevant.
Write at least 150 words.
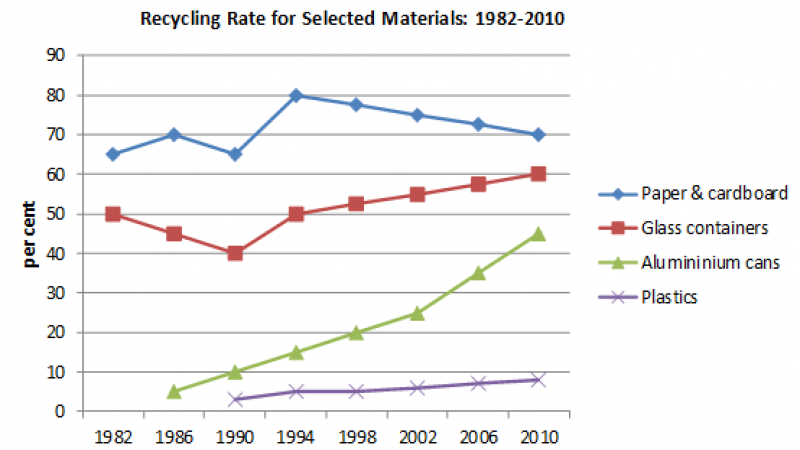
The graph compares the percentages of paper and cardboard, glass containers, aluminum cans, and plastics recycled in a country from 1982 to 2010.
The percentage of paper and cardboard recycled in this period was consistently higher than any of the other three. While paper and cardboard and glass containers were recycled from 1982, recycling of plastic started only in 1990, and it was the least recycled item among the four.
In detail, the percentage of paper and cardboard recycled in 1982 was 65, and there was no sharp rise until 2010 when it was 70. In 1990, around 5% of plastic was recycled but, however, there was no significant increase till 2010. Further, recycling of glass containers which was at 50% in 1982, did not have any substantial increase or decrease till 2010. In the 28-year period, the recycling of aluminum cans had a remarkable increase—from around 3% in 1986 to 45% in 2010.
Get the Weekly English Kit 📬
New words, one handy idiom, and a 2-minute quiz — delivered to your inbox to keep your streak alive.
 Related Questions