
Please check my IELTS task 1
The line graph compares how much oil was consumed by four main users in the period of 1990 to 2020.
Overall, the figures for oil demand of the USA and Western Europe delineced over this period, while China and the Middle East gradually increased. In addition, the statistic for oil consumption in the USA was the highest throughout the entire period.
In 1990, there was about 9 million oil used by the USA compared with 4 million from Western Europe. During the next 10 years, the amount of oil used by the USA increased around 10 million, then fell to nealy 7,5 million by 2020. Besides, the figures of oil consumed in Western Europe dropped gradually back to around 2 million over a 30-year period.
The total amount of oil consumed in China was 2 million by 1990, and registered a growth slowly to 4 million between 1990 to 2010, but then at the end of the period, the figures declined slightly to 3,5 million . While, consumption of oil in the Middle East was nearly 2 million in 1990 and there was a progressively increase of 1 million in oil consumed from 2 million to 3 million from 1990 to 2020.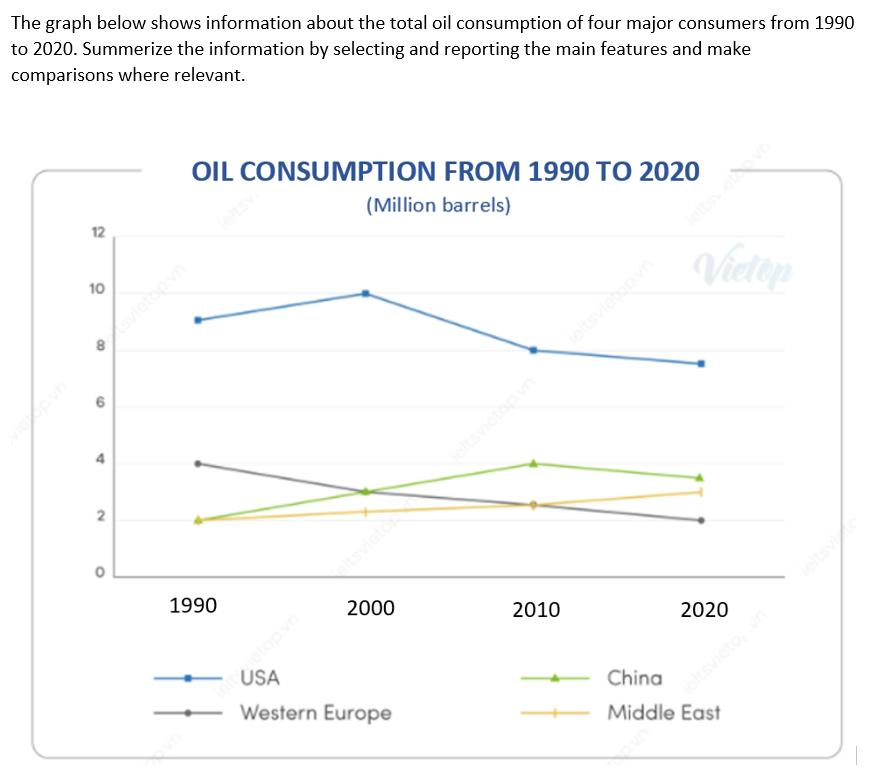
Get the Weekly English Kit 📬
New words, one handy idiom, and a 2-minute quiz — delivered to your inbox to keep your streak alive.
 Related Questions