
Please check my Ielts task 1
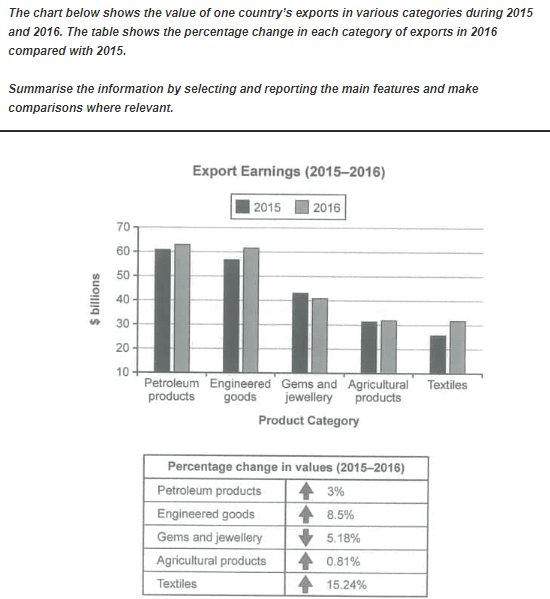
The bar chart plots the export earnings of one country in five categories: petroleum products, engineered goods, gems and jewellery, agricultural products, and textiles in two consecutive years: 2015-16. The accompanying table shows changes in percentage points in each category of exports in 2016 in comparison with 2015.
Overall, revenues from exports of all listed categories, with the exception being gems and jewellery increased, and the most notable change concerned textiles. Also, values of exports in petroleum products and engineered goods were consistently the highest, whereas the inverse was true for textiles.
In detail, revenues from petroleum products led the way with figures of 61 and 63 billion dollars in two years in question. Those from exports of engineered goods were the second highest though increasing by 8.5%, nearly tripling the increased rate of petroleum products. 2016 saw a marginal rise in values of exports in agricultural products, but a steep one in those in textiles from approximately 27 to over 31 billion dollars in 2016, representing a 15.24 increase.
However, gems and jewellery was an outlier in that only export earnings from this category decreased by 5.18%, from nearly 42 to about 40 billion dollars in 2016.
Top answer
The bar chart plots [ 1] the one country’s export earnings of one country in from five categories: petroleum products, engineered goods, gems and jewellery, agricultural products, and textiles in two consecutive years: 2015-16. The accompanying table shows changes in percentage points terms in each category of exports in 2016 in comparison with 2015. Overall, revenues from exports of all listed categories, with the exception being of gems and jewellery increased, and the most notable change concerned textiles.
- The bar chart plots [ 1] the one country’s export earnings of one country in from five categories: petroleum products, engineered goods, gems and jewellery, agricultural products, and textiles in two consecutive years: 2015-16.
- The accompanying table shows changes in percentage points terms in each category of exports in 2016 in comparison with 2015.
- Overall, revenues from exports of all listed categories, with the exception being of gems and jewellery increased, and the most notable change concerned textiles.
- Also, values of exports in of petroleum products and engineered goods were [ 2] consistently the highest, whereas the inverse opposite was true for textiles.
- [ 3] In detail, revenues from petroleum products led the way with figures of 61 and 63 billion dollars in the two years in question.
Get the Weekly English Kit 📬
New words, one handy idiom, and a 2-minute quiz — delivered to your inbox to keep your streak alive.
The bar chart plots [ 1] the one country’s export earnings of one country in from five categories: petroleum products, engineered goods, gems and jewellery, agricultural products, and textiles in two consecutive years: 2015-16. The accompanying table shows changes in percen
 Related Questions