
Please check my Ielts task 1
The chart below shows the global sales of different kinds of digital games from 2000 to 2006.
My essay:
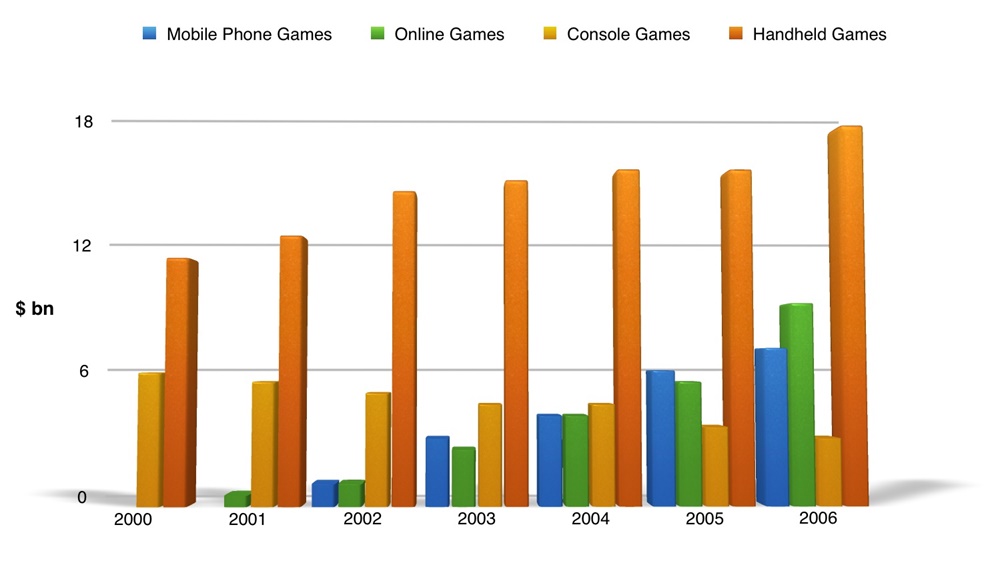
The time-series clustered bar chart plots the global sales of four kinds of digital games: mobile phone games, console games, online games, and handheld games during a specific seven-year period, starting from 2000.
Overall, there are only sales of console and handheld games presented on this chart in 2000, and an additional sales of online games in 2001. But from 2002 onwards, sales of four types of digital games are fully presented on this chart. Also, sales of handheld games were consistently the highest. They showed no sign of decreasing during the given period, which was also the pattern of sales of online and mobile phone games, but was not the case for sales of console games.
In detail, sales of handheld games increased linearly at a rate of approximately 2 billion dollars during the time frame apart from the two years 2004 and 2005 with sales plateauing at about 15 billion dollars, and reached nearly 18 billion dollars in 2006. Meanwhile, those of console games dropped gradually from 6 billion to half of that in 2006. Though sales of mobile phone games are presented on the chart in 2002, they were on a par with those of online games which are shown in 2001. After a five-year period, there was a marked difference between the two figures, with the 2006 figure for sales of mobile phone games being well over 6 billion dollars, and that of online games being slightly above 10 billion dollars.
Get the Weekly English Kit 📬
New words, one handy idiom, and a 2-minute quiz — delivered to your inbox to keep your streak alive.
 Related Questions