
Please check my IELTS Task 1
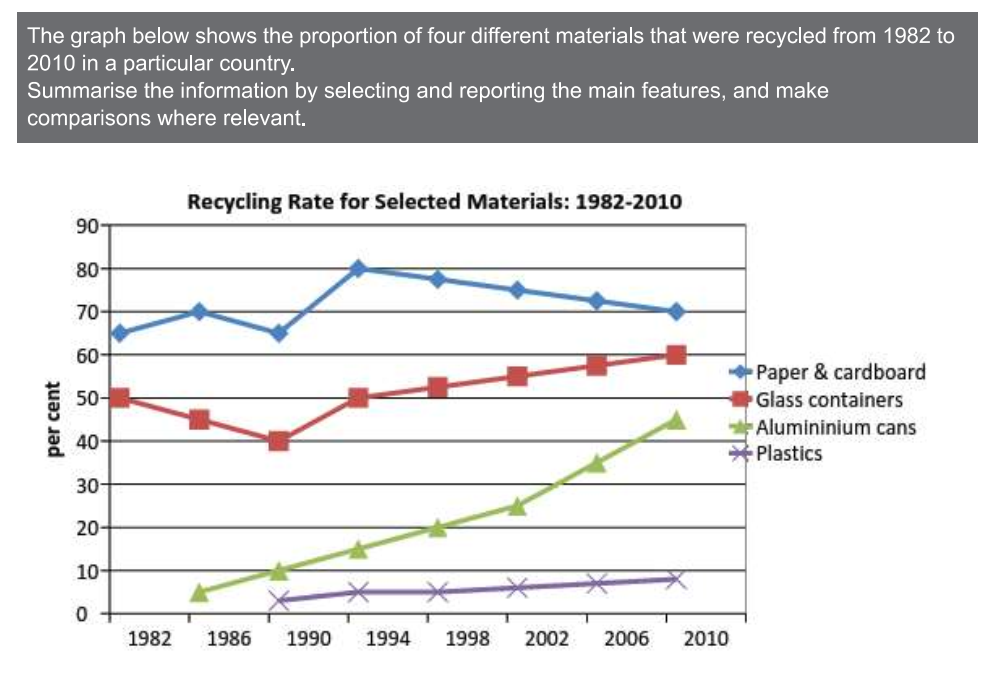
The line chart illustrates the percentage of different materials that were recycled in a country between 1982 and 2010.
Overall, paper and cardboard always had the highest percentage of recycling. In addition, except for paper and cardboard, all materials saw an upward trend in their figures.
Looking first at paper and cardboard, it started at 65% in 1982, it then fluctuated around 65% to 70% from 1982 to 1990. The recycling rate of paper and cardboard reached a peak of 80% in 1994. Afterward, this proportion declined and ended the period at 70%.
As for other materials, glass containers began with 50% in 1982 and fell by 10% in 8 years later, recycling of aluminum cans and plastics started later, the figures were under 10%. From 1990 to 2010, the proportion of glass containers climbed slightly by 20% in 20 years. Similarly, the figure for plastics went mildly under 10%. On the contrary, the proportion of aluminum climbed significantly by 35% for 20 years.
Get the Weekly English Kit 📬
New words, one handy idiom, and a 2-minute quiz — delivered to your inbox to keep your streak alive.
 Related Questions