
Please check my Ielts task 1
The line graph depicts the number of visitors coming to a specific country for a short trip, and the number of that country's inhabitants going on a short foreign trip between 2009 and 2011.
From a brief inspection, there was a steady rise in the number of resident departures, whereas the quantity of visitor arrivals underwent some changes.
With respect to resident leaving, the initial number was roughly 550 thousands people, only 9 percent of higher than that of visitor arrivals. During the time frame, it showed no signs of declining, and the last statistics was over 650 thousands people, marking a 15 percent increase.
By contrast, the starting point of visitor influx was approximately 490 thousands people in Oct-09. It experienced a minimal growth to exactly 500 thousands people in Feb-10, after which was a month of stabilization, before reaching its peak of nearly 530 thousands people in Oct-10. Subsequently, there was a consistent yet steep decline in the number of visitor arrivals to merely the first number in Jun-11.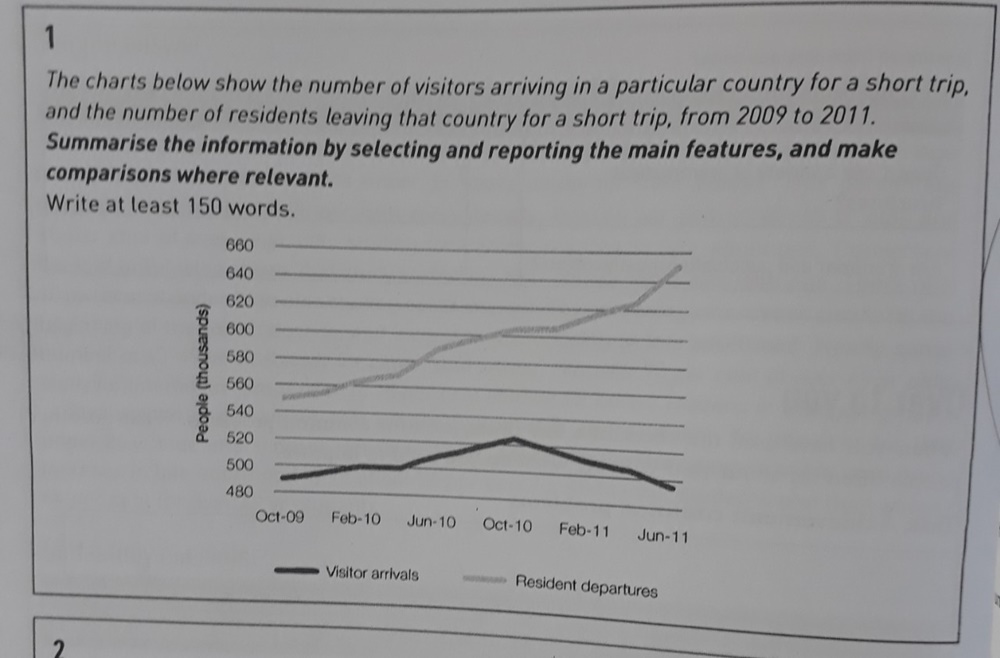
Top answer
Please check my essay. I have corrected some mistakes in it. The line graph depicts the number of visitors coming to a specific country for a short trip, and the number of that country's inhabitants going on a short foreign trip between 2009 and 2011.
- Please check my essay.
- I have corrected some mistakes in it.
- The line graph depicts the number of visitors coming to a specific country for a short trip, and the number of that country's inhabitants going on a short foreign trip between 2009 and 2011.
- Overall, there was a steady rise in the number of resident departures, whereas the quantity of visitor arrivals underwent some changes.
- With respect to resident leaving, the initial number was roughly 550 thousands people, only 9 percent of higher than that of visitor arrivals.
Get the Weekly English Kit 📬
New words, one handy idiom, and a 2-minute quiz — delivered to your inbox to keep your streak alive.
Please check my essay. I have corrected some mistakes in it.
The line graph depicts the number of visitors coming to a specific country for a short trip, and the number of that country's inhabitants going on a short foreign trip between 2009 and 2011.
Overall, there was a steady rise in the number of resident departures, whereas the quantity of visitor arrivals underwent some chang
 Related Questions