
Please check my IELTS essay
Topic: Summarise the information presented in this graph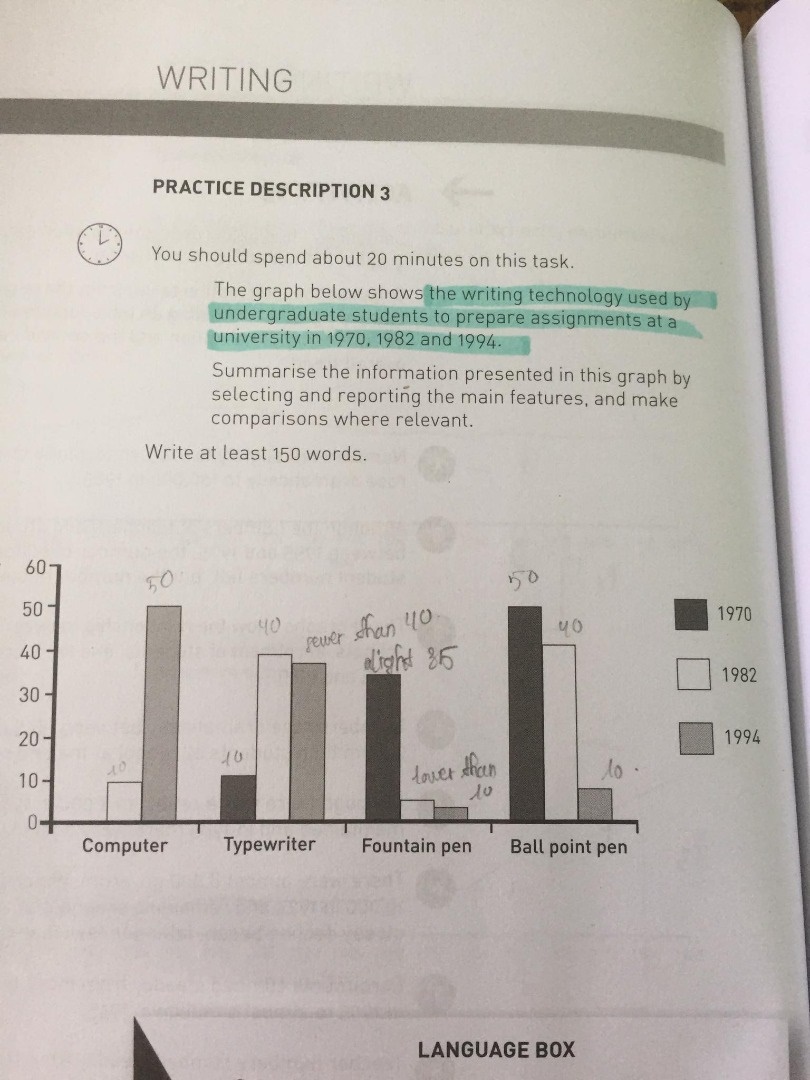
My essay:
The bar chart compares the usage of 4 writing devices to prepare assignments of undergraduate students at a university between 1970 and 1994, measured by percentage of total assignment. At first glance, it is clear that the ball point pen was used most frequently by bachelor students from 1970 to 1982, while computers had a dramatic growth in 1994.
In 1970, the ballpoint pen was the most preferable method for preparing assignments with a figure of 50%, whereas no figure of computer was recorded. The percentages dropped slightly to 40% in 1982 prior to a steep fall of 10% in 1994. On the other hand, computer, between 1982 and 1994, witnessed a sharp increase of 400%, from 10% to 50% respectively.
The other two chosen methods were typewriter and fountain pen. Typewriter rose considerably from 10% to 40% in the 12 years period and remained around that figure till 1994. Besides, starting from a figure of slightly 40%, fountain pen showed a steep decrease in 1982 and continued to climb downwards to lower than 10% in 1994.
Get the Weekly English Kit 📬
New words, one handy idiom, and a 2-minute quiz — delivered to your inbox to keep your streak alive.
 Related Questions