
PLEASE CHECK MY ESSAY - IELTS TASK 1. THANK YOU.
Question:
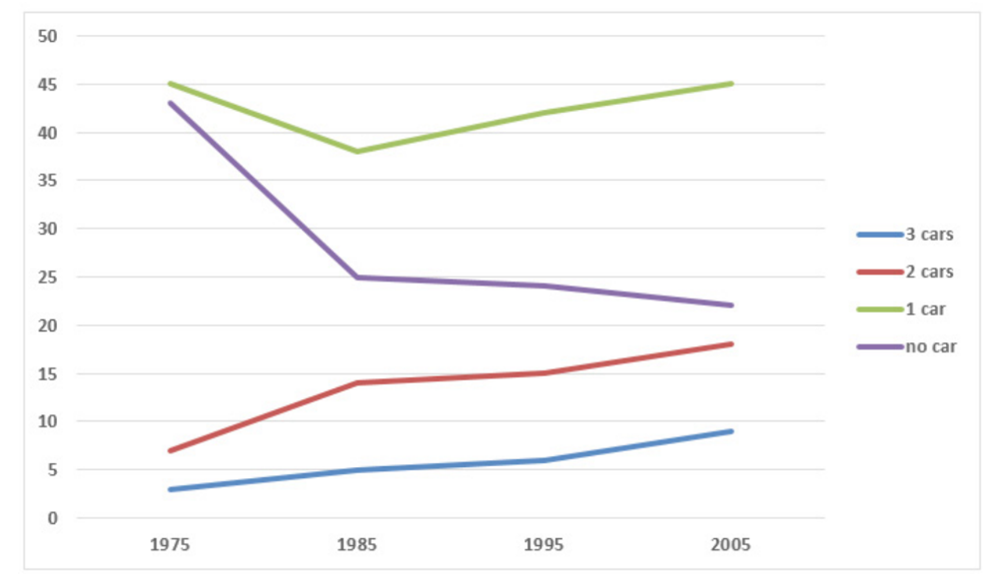
The chart below gives information about car ownership in the UK from 1975 to 2005.
Answer:
The provided line graph illustrates changes in car ownership in the UK over a period of thirty years starting from 1975.
Overall, it is evident that while the proportion of people who owned two cars and three cars increased, the opposite was true for the percentage of no-car ownerships. Additionally, the figure for owners of one car was the highest during the research period.
In the year 1975, the number of people who possess one car stood at about 45%, in comparison with nearly 46% for that of no-car owners. Then these figures witnessed a sharp decline to around 37% and 25% respectively over the next ten years, before the former tended to bounce back to the same figure of 1975 while the latter experienced a minimal decrease of 4% over the last 20 years of the research period.
Although the number of citizens who own two cars and three cars stood at just approximately 6% and 4% respectively in the first year of the given period, they both maintained a stable rise up to 19% and 9% in the same order till the end. However, the first ten years saw a significant increase of about 8% in the quantity of two-car owners as opposed to only 2% that of three-car owners.
Top answer
Please read my advice for Task 1 essays. Also, when you mention data values, be sure to write the correct numbers. IELTS TASK 1: Hints, Tips And Advice Vocabulary Words For Task 1: Reference Post The provided line graph illustrates (not a good word choice.
- Please read my advice for Task 1 essays.
- Also, when you mention data values, be sure to write the correct numbers.
- IELTS TASK 1: Hints, Tips And Advice Vocabulary Words For Task 1: Reference Post The provided line graph illustrates (not a good word choice.
- ) in the UK over a period of thirty years starting from 1975.
- (You have not fully described the graph.
Get the Weekly English Kit 📬
New words, one handy idiom, and a 2-minute quiz — delivered to your inbox to keep your streak alive.
Please read my advice for Task 1 essays. Also, when you mention data values, be sure to write the correct numbers.
 Related Questions