
Please check my essay
The line graph compares the amount of fossil fuel energy produced in Europe from 1981 to 2001.
Overall, it can be seen that petroleum was the most important source of energy generated in Europe over the given period. Moreover, the figures for energy production from natural gas overtook the percentage of coal.
In 1981, petroleum generated 35 trillion units. There was a slightly rise to 40 trillion units in 1986. The figures then experienced a gradual drop to just under 40 trillion units in 1991 and saw a massive increase to 50 trillion units in 2001
In terms of other energy sources, the proportion of coal ranked as second by 30 trillion units. However, the equivalents then fell steadily to just under 20 trillion units over twenty years. While the energy generated from natural gas which was ranked behind coal, witnessed a considerable increase, rising from 9 trillion units in 1981 to 20 trillion units in 1991. It then overtook the amount of energy produced from coal and reached its peak of 33 trillion units at the end of the period.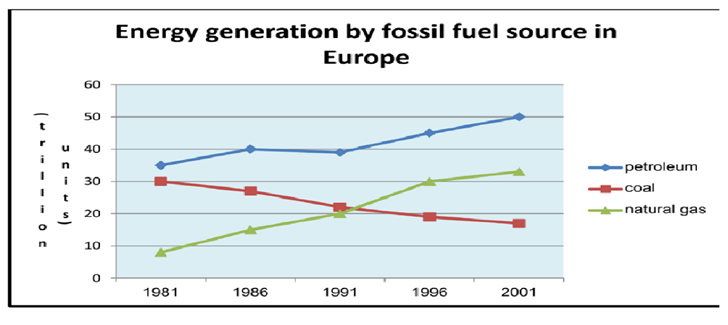
Top answer
The line graph compares the amount of fossil fuel energy produced from three types of fossil fuels in Europe from 1981 to 2001. Overall, [ 1 ] it can be seen that petroleum was the most important source of energy generated in Europe fuel over the given period. Moreover, the figures for energy production produced from natural gas overtook the percentage of that from coal.
- The line graph compares the amount of fossil fuel energy produced from three types of fossil fuels in Europe from 1981 to 2001.
- Overall, [ 1 ] it can be seen that petroleum was the most important source of energy generated in Europe fuel over the given period.
- Moreover, the figures for energy production produced from natural gas overtook the percentage of that from coal.
- In 1981, petroleum generated 35 trillion units.
- After that, t here was a slightly rise to 40 trillion units in 1986.
Get the Weekly English Kit 📬
New words, one handy idiom, and a 2-minute quiz — delivered to your inbox to keep your streak alive.
The line graph compares the amount of fossil fuel energy produced from three types of fossil fuels in Europe from 1981 to 2001.
Overall, [ 1] it can be seen that petroleum was the most important source of energy generated in Europe fuel over the giv
 Related Questions