
Please check my essay
The given line graph provides information on the number of times the teenagers from Australia consumed fast food annually from 1975 to 2000.
In general, although the consumption of fish and chips decreased over the period, hamburgers and pizza, on the other hand, increased.
In 1975, the Australian teenagers consumed fish and chips the most, at 100 times for the whole year. The figure varied for the next 10 years - dipping to well above 80 for the first half, then rising to approximately 90 by the end of the second half, before continuously falling to 40 times a year in 2000.
In contrast, hamburgers, which was the second most eaten fast food in 1975, at 5 times for 12 months, skyrocketed to around 85 after a decade, before gradually soaring to 100 by the end of the timeframe. Similarly, pizza, which was least consumed in the beginning of the period, eaten at roughly 5 times annually, followed an increasing trend. The figure significantly soared to well above 80 after 4 decades before remaining constant for the next 5 years. 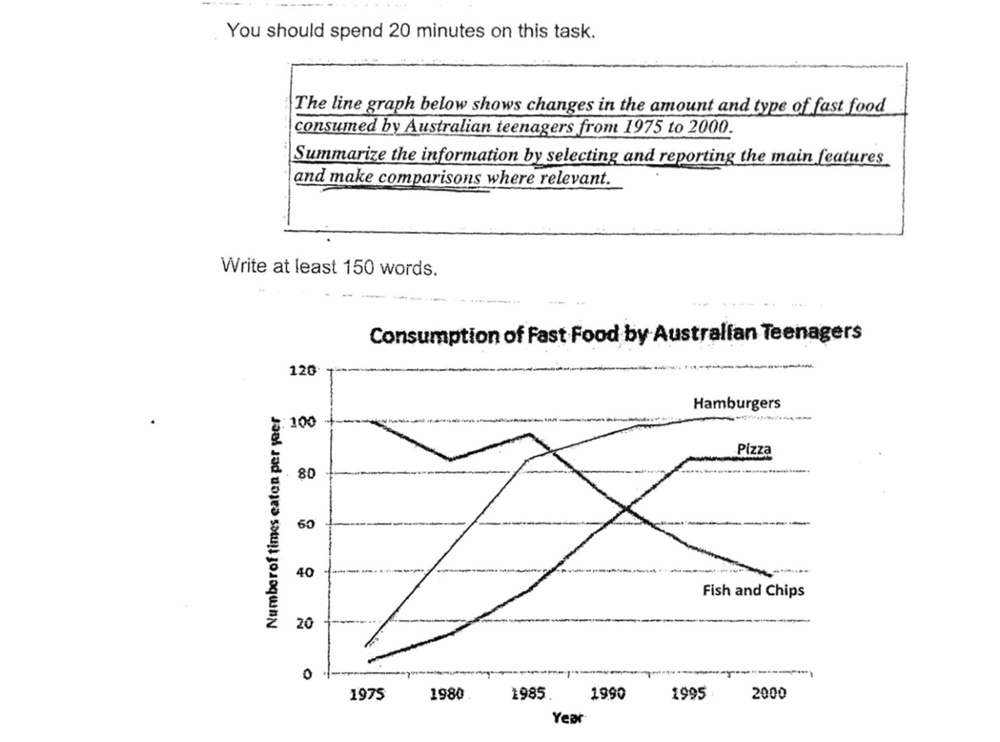
Top answer
The given line graph plots / gives / shows / depicts provides information on the number of times the teenagers in from Australia consumed fast food annually from 1975 to 2000. (incomplete. - How many kinds of fast food?
- The given line graph plots / gives / shows / depicts provides information on the number of times the teenagers in from Australia consumed fast food annually from 1975 to 2000.
- (incomplete.
- - How many kinds of fast food?
- ) The line graph depicts the number of times that teenagers in Australia ate fast food meals, namely, Hamburgers, Pizza and Fish and Chips, each year from 1975 to 2000.
- In general, although the consumption of fish and chips decreased over the period, hamburgers and pizza, on the other hand , increased.
Get the Weekly English Kit 📬
New words, one handy idiom, and a 2-minute quiz — delivered to your inbox to keep your streak alive.
The given line graph plots / gives / shows / depicts provides information on the number of times the teenagers in from Australia consumed fast food annually from 1975 to 2000. (incomplete. - How many kinds of fast food? What were they?)
The line
 Related Questions