
Please check my essay.
Topic: the graph shows the number of visitors to four international museums between 1980 and 2015. Summarise the information by selecting and reporting the main features and make comparisons where relevant. Write at least 150 words.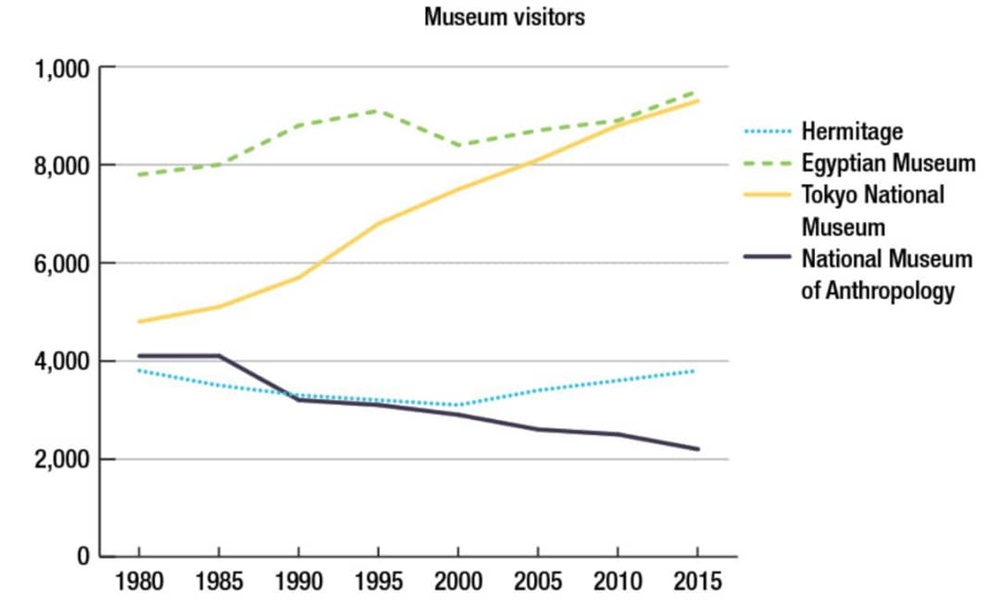
My essay:
The line graphs give information about the number of visitors in 4 different countries from 1980 to 2015. Two countries show an increase in the number of visitors (Egyptian and National Tokyo Museum), while Hermitage's visitors are the same and National Museum of Anthropology has a slowly drop.
The first significant graph is for Egyptian Museum. It was the most popular over the thirty-five year period by almost 9 million visitors in 2015. Its visitors were about a little under 8 million in 1980. Its visitors the same Tokyo Museum's in 2015, but the population of Tokyo museum's visitors had a big rising trend, about 5 million visitors between 1980 and 2015.
The least number of visitors is for National Museum of Anthropology in 2015. Its visitors population is just over 2 million. It has a slowly drop in these years, from just over 4 million in 1980 to around 2 million in 2015. What is more, Hermitage's visitors remained about the same during this period. Between 1980 and 2000, the number of its visitors decreased from 4 million to a little over 3 million and then rose to around 4 million again in 2015.
Top answer
We have given you a lot of help, but not one time have you thanked us. Why should we do the thankless work of spending time with your essays when there are many more students waiting for help?
- We have given you a lot of help, but not one time have you thanked us.
- Why should we do the thankless work of spending time with your essays when there are many more students waiting for help?
Get the Weekly English Kit 📬
New words, one handy idiom, and a 2-minute quiz — delivered to your inbox to keep your streak alive.
We have given you a lot of help, but not one time have you thanked us. Why should we do the thankless work of spending time with your essays when there are many more students waiting for help?
The line graphs (There is only one graph.) give information about (Vague, unclear. Be exact) the number of visitors in 4 (use words, not numerals for small numbers) different countries
The line graph delineates data of number of tourists that went to four international museums over a period of 35 years
The line graph illustrates the four international museums such as Louvre, Vatican museums, London Science museum and Shenzhen museum, in there several travellers were visited from 1980 to 2015.
Overall, it can be seen that the Louvre Museum was already famous for the highest number of visitors visited in 1980, while over the period, which was more populated in 2015. However, the drammati
 Related Questions