
please check my essay
The table below presents the number of children ever born to women aged 40-44 years in Australia for each year the information was collected since 1981.
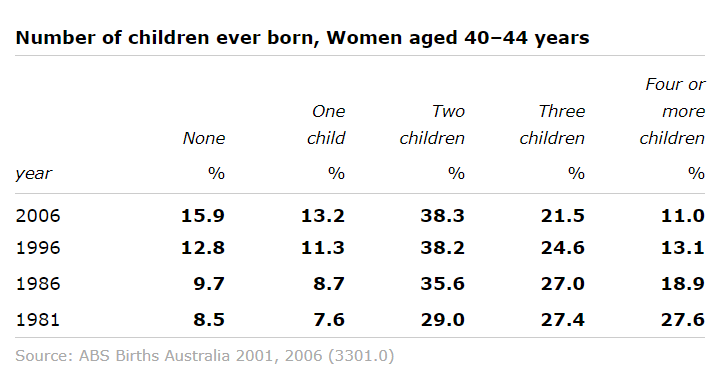
The table provides information about the number of children ever born to women aged 40-44 years for concrete years since 1981 in Australia.
Overall, the number of women aged 40-44 years had two children made up the highest proportion and were prone to increase from 1981 to 2006, while the families had four or more children considerably increased.
In detail, women had no children accounted were on the rise with beginning at just 8.5% in 1981 then increase to 12.8% and 15.9% in 1996 and 2006 respectively. By comparison, one - child families had a similar rate with beginning at 7.6% in 1981, 11.3% in 1996 and 13.2% in 2006.
In addition, two - children families hold the highest of proportion among all participations and had an upward trend in each year, namely, 29% in 1981, 35.6% in 1986 then grew up by 3.1% in the next 20 - year. In contrast, women likely had three or more children were in negative territory. 27.4% is the impressive percentage of three - children families in 1981 then gradually decreased to 21.5% in 2006. Meanwhile, women had four or more children witnessed a plunge: 27.6% and 18.9% in 1981 and 1986 respectively and fall to the worst proportion of 11% in 2006.
Top answer
The table provides information about the number of children ever born to women aged 40-44 years for concrete years (Concrete year is incorrect English. How many years? ) since 1981 in Australia.
- The table provides information about the number of children ever born to women aged 40-44 years for concrete years (Concrete year is incorrect English.
- How many years?
- ) since 1981 in Australia.
- ) Your first paragraph inadequately describes the table.
- The table gives the distribution, in percentages, of women aged 40-44 who had had different numbers of children, ranging from no children to four or more children.
Get the Weekly English Kit 📬
New words, one handy idiom, and a 2-minute quiz — delivered to your inbox to keep your streak alive.
The table provides information about the number of children ever born to women aged 40-44 years for concrete years (Concrete year is incorrect English. How many years? What are they?) since 1981 in Australia. (What numbers of children are given?) Your first paragraph inadequately describes the table.
The table gives the distribution, in percentages, of women aged 40-44 who had
 Related Questions