
Please check my essay!
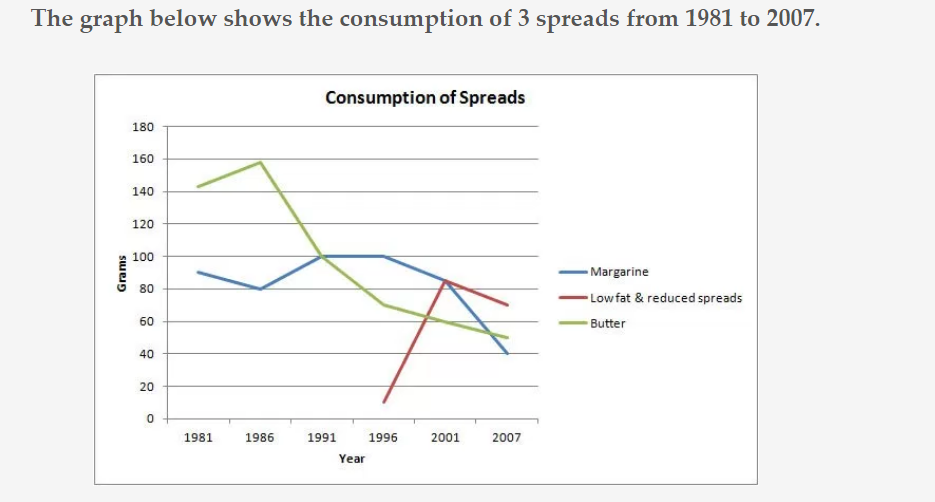
The given line graph gives information about the quantity of grams of three kinds of soft foods consumed during 1981 to 2007.
In general, the consumption of butter had a tendency to change dramatically over the researched period. Besides, the amount of low fat and reduced spreads increased from the appearance time in the year 1996 to 2007.
As can be clearly seen that there was approximately 140 grams eaten by people. Meanwhile, about 90 grams of margarine was consumed in meals. After 5 years, the quantity of butter consumption went up to nearly 160; the figure for margarine dropped about 180 in contrast. In the year 1991, there was 100 grams of both above categories dined.
In 1996, individuals started eating low fat and reduced soft foods, staying at roughly 10 grams. Butter, besides, was used at the same time. In the next 5 years, the amount of margarine and low fat spreads were upper 80; while the figure for category was 60. Approximately 70,50 and 40 grams of reduced soft foods, butter and margarine were eaten in meals in the year 2007, respectively.
Top answer
Let's change the words to this: The line graph (above, below, or to the right or left) shows the number of grams of three kinds of soft foods consumed (by whom? how many? ) between 1981 - 2007.
- Let's change the words to this: The line graph (above, below, or to the right or left) shows the number of grams of three kinds of soft foods consumed (by whom?
- how many?
- ) between 1981 - 2007.
- In general, consumption of butter changed dramatically over this period.
- ] spreads increased from when they appeared in 1996 to 2007.
Get the Weekly English Kit 📬
New words, one handy idiom, and a 2-minute quiz — delivered to your inbox to keep your streak alive.
Let's change the words to this:
The line graph (above, below, or to the right or left) shows the number of grams of three kinds of soft foods consumed (by whom? how many? where?) between 1981 - 2007. In general, consumption of butter changed dramatically over this period. Also, the amount of low fat and reduced [calorie?] spreads increased from when they appeared in 1996 to 2007.
 Related Questions