
Please check mu essay. Thank you.
The bar charts below show the percentages of men and women in employment in three countries in 2005 and 2015.
Summarise the information by selecting and reporting the main features, and make comparisons where relevant.
My essay:
The bar charts show employment rates of men and women in three countries in the years 2005 and 2015.
Overall, we can see that employment rates increased in both gender and the percentage of employed females have had the most significant increase.
According to the charts, the proportion of employed men was greater than the women. In all of the countries covered, Japan has the highest rate for men, who were working, about 75%% in 2005. It has increased just a little in 2015, approximately 3%. Australian men who were employed, have the lowest rate, just over 60% in 2005. In 2015, their proportion has rose until 70% in 2015, which is the same as Ireland employments, with just a little increase.
As shown, females’ proportion was under 50% everywhere in 2005. Australian women in employment have had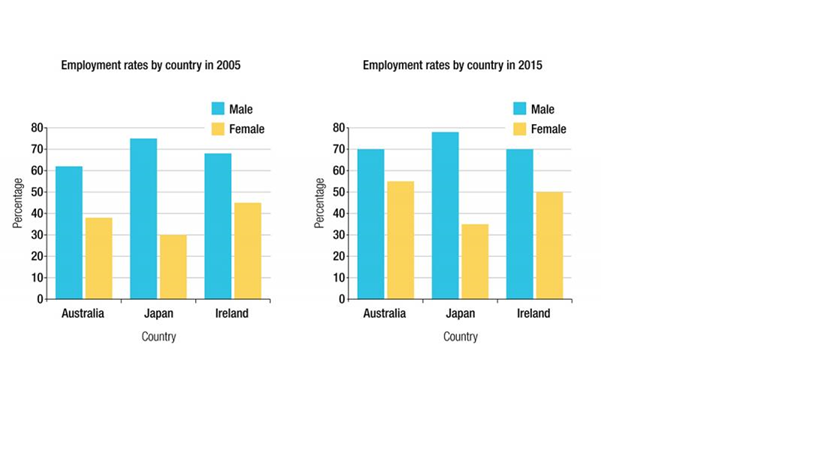
the most increase, about 15% from just a little under 40% in 2005. In Ireland, the rate has reached exactly 50%, with about 6% rise. Japanese females who were in the lowest rank between all men and women, have increased only about 35% which is lower than the half of Japanese employed men.
Top answer
" It will not be accurate. This economic statistic has a very precise definition. If you use your own phrases, you will lose that definition.
- " It will not be accurate.
- This economic statistic has a very precise definition.
- If you use your own phrases, you will lose that definition.
- ) show employment rates of men and women in three countries in the years 2005 and 2015.
- (Incomplete.
Get the Weekly English Kit 📬
New words, one handy idiom, and a 2-minute quiz — delivered to your inbox to keep your streak alive.
Do not use any synonyms or other phrases ("men who were working" / "employed men" / proportion of employed / "women in employment") for "employment rate." It will not be accurate. This economic statistic has a very precise definition. If you use your own phrases, you will lose that definition.
The bar charts (How many bar charts?) show employment rates of men and women i
 Related Questions