
PLEASE! CHECK FOR MY WRITING TASK 1! HELP ME !
The given chart depicts the changing number of people migrating into and out of the UK during a 10-year period, from 1993 to 2002.
Overall, as can be observed, both figures increased over the shown period. At the beginning of the period, in 1993, the number of migrants was slightly larger than that of immigrants and the growth rate of inflow of British was higher than that of the 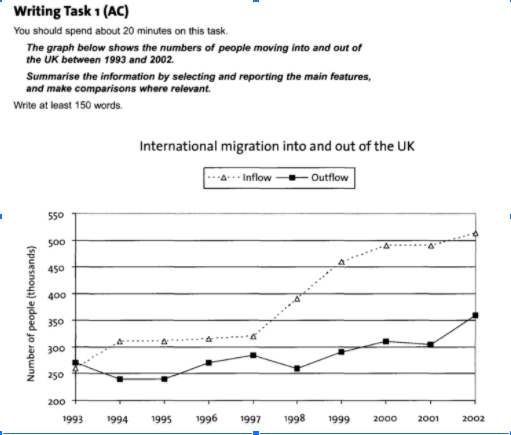
outflow.
Before maintaining the same level for 4 years from 1994, the inflow of migrants increased by 20 percent between 1993 and 1994. In the next 3 years, from 1997, the figures rocketed to 500 thousand, then less sharply from 1999 to the end of the period and reached a peak of above 500 thousand people in 2002.
Regarding the outflow of British, There were mild fluctuations in the number of immigrants from 1993 to 1998, ranging between 250 and 300 thousand people; However, the figures saw a partial growth over the next 2 years, reaching above 300 thousand during the next 2 years before stabilizing at 350 thousand people in 2002.
Top answer
The given chart depicts the changing number of people migrating into and out of the UK during a 10-year period, from 1993 to 2002. Overall, as can be observed, both figures increased over the shown period. At the beginning of the period, in 1993, the number of migrants was slightly larger than that of immigrants and the growth rate of inflow of British was higher than that of the outflow.
- The given chart depicts the changing number of people migrating into and out of the UK during a 10-year period, from 1993 to 2002.
- Overall, as can be observed, both figures increased over the shown period.
- At the beginning of the period, in 1993, the number of migrants was slightly larger than that of immigrants and the growth rate of inflow of British was higher than that of the outflow.
- Before maintaining the same level for 4 years from 1994, the inflow of migrants increased by 20 percent between 1993 and 1994.
- In the next 3 years, from 1997, the figures rocketed to 500 thousand, then less sharply from 1999 to the end of the period and reached a peak of above 500 thousand people in 2002.
Get the Weekly English Kit 📬
New words, one handy idiom, and a 2-minute quiz — delivered to your inbox to keep your streak alive.
 Related Questions