
Please check for my writing task 1
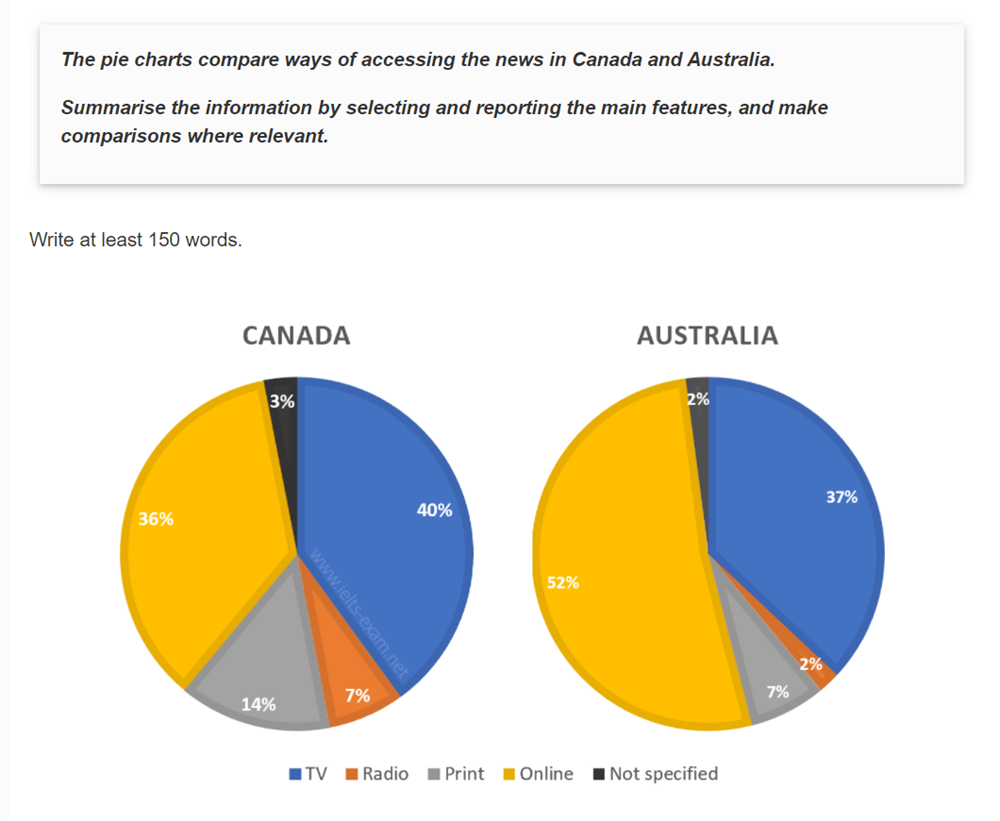
The pie charts display the proportion of finding news in Canada and Australia regarding five different methods.
Overall, sectors of the two charts have the same patterns with several differences in the figure. In addition, except TV and Online sectors, in two nations, the last three groups ranked in order print, radio and not specified.
In detail, the number of accessing online news occupied a significant share of the chart. While in Canada, it accounted for more than a third, that of Australia is over a half (52%). The next prominent sector is TV news which has the relative percentages in two nations with the figure being around 40%. The figure for print news in Canada was twice as many as that of Australia, at 14% and 7% respectively. Listening to the news on the radio in Canada was three times that in Australia was. Nowadays, finding news through the Internet is more and more popular than any others method.
Top answer
The pie charts display the proportion of finding news (that is very awkward and unnatural) in Canada and Australia regarding five different methods. (That is not very precise. "Not Specified" is not a method.
- The pie charts display the proportion of finding news (that is very awkward and unnatural) in Canada and Australia regarding five different methods.
- (That is not very precise.
- "Not Specified" is not a method.
- ).
- Overall, sectors of the two charts have the same patterns with several differences in the figure .
Get the Weekly English Kit 📬
New words, one handy idiom, and a 2-minute quiz — delivered to your inbox to keep your streak alive.
The pie charts display the proportion of finding news (that is very awkward and unnatural) in Canada and Australia regarding five different methods. (That is not very precise. "Not Specified" is not a method. ).
Overall, sectors of the two charts have the same patterns with severa
Sample essay:
The two pie charts, one for Canada and the other for Australia, break down the population into groups according to the primary way in which they get their news. Specifically, the charts show the percentage of people who go to either TV, Radio, Print media or the internet for news. There is also a miscellaneous category for all other sources.
Overall, the distribu
 Related Questions