
Please check and score my task 1 writting. Thank you so much
The charts below show the changes in ownership of electrical appliances and the amount of time spent doing housework in households in one country between 1920 and 2019.
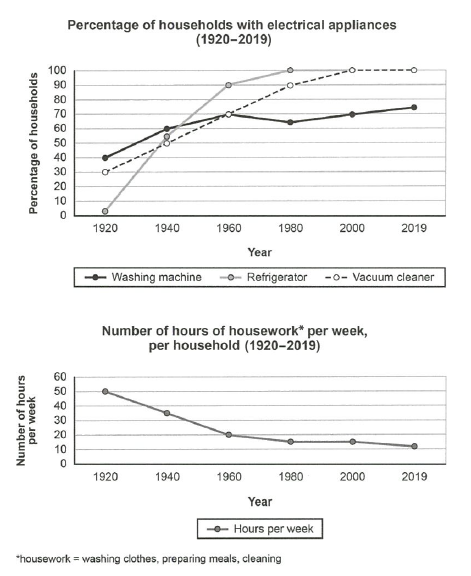
The two graphs represent the proportion of family units possessing three distinct home electronics, (namely washing machine, refrigerator, and vacuum cleaner), and the aggregate figure of weekly house chore hours in each household from 1920 to 2019.
Overall, as more residents acquired electrical appliances, less time is spent on housekeeping tasks. Furthermore, refrigerator and vacuum cleaner gradually became the requisite items in each family.
In 1920, washing machines and vacuum cleaners constituted the most common electrical appliances with proportions at 40% and 30%, respectively. While the initial figure for refrigerators was at just over 0%, it increased sharply by 90% in the next 20 years and surpassed the others (70%) in 1960. The percentage of households owning vacuum cleaners and refrigerators continued to increase until plateauing at 100% in 2000 and remained at this pace to 2019 while that of washing machines slightly dropped in 1980 then rebounded marginally to about 75% by 2019.
As the result, total time spent doing housework fell sharply from 50 hours a week in 1920 to 20 by 1960; then decline steadily, ultimately reached 10 hours a week at the end of the period.
Top answer
The two graphs represent the proportion of family units possessing three distinct home electronics , (That is incorrect. ) (namely washing machine, refrigerator, and vacuum cleaner), and the aggregate figure (wrong word) average number of weekly house chore hours (awkward) in each household from 1920 to 2019. Overall, as more residents people acquired electrical appliances, they spent less time is spent on housekeeping tasks.
- The two graphs represent the proportion of family units possessing three distinct home electronics , (That is incorrect.
- ) (namely washing machine, refrigerator, and vacuum cleaner), and the aggregate figure (wrong word) average number of weekly house chore hours (awkward) in each household from 1920 to 2019.
- Overall, as more residents people acquired electrical appliances, they spent less time is spent on housekeeping tasks.
- Furthermore, a refrigerator and vacuum cleaner gradually became present in every home the requisite items in each family.
- In 1920, washing machines and vacuum cleaners were constituted the most common electrical appliances with proportions at 40% and 30%, respectively.
Get the Weekly English Kit 📬
New words, one handy idiom, and a 2-minute quiz — delivered to your inbox to keep your streak alive.
The two graphs represent the proportion of family units possessing three distinct home electronics, (That is incorrect. The two graphs plot different values, If the graphs or pie charts show different subjects, you have to describe them separately..) (namely washing machine, refrigerator, and vacuum cleaner), and the aggregate
Sample essay
The first line graph plots the percentage of homes which have purchased a labor-saving household appliance in a particular country between 1920 and 2019. Three appliances are in the graph: refrigerator, vacuum cleaner and washing machine. The second line graph plots the average amount of time spent weekly on common chores (cooking, cleaning and laundry) per household duri
 Related Questions