
Please advise me on Writing Task 1. Thanks in advance.
The charts summarise the weight measurements of people living in Charlestown in 1955 and 2015.
Summarise the information by selecting and reporting the main features, and make comparisons where relevant.
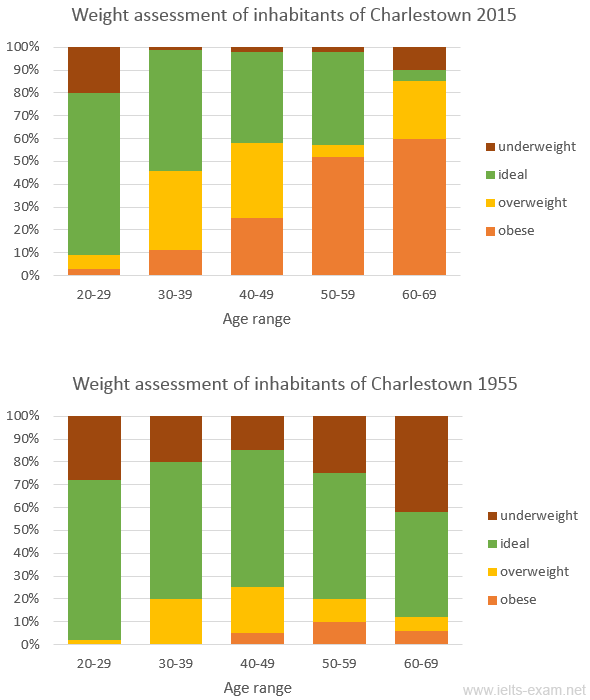
These bar charts compare the assessment of the weight of Charlestown population in the years 1955 and 2015.
It is clear that ideal people accounted for the large majority of the most age range in both years. Besides, the number of people who are underweight had decreased by 2015.
A detailed look at the charts reveals that the youngest age range remained the highest proportion of ideal people, around 70% in two years. In 1955, there were negligible obese, however, this range of weight rose rapidly over the period of 60 years. Especially, in 2015, in the age range of 60-69, approximately 60 out of 100 people were obese.
The number of underweight was assessed as the second-biggest percentage in the year 1955, but that went down considerably to the smallest minority for all age group, always under 10%, except for the 20-29-year-olds at 20%. The amount people who had heavyweight saw a moderate rise, especially for the 30-39-year-old people and the 40-49-year-old people.
Top answer
These bar charts compare the assessment of the weight of Charlestown population in the years 1955 and 2015. It is clear that ideal people accounted for the large majority of the most age range in both years. Besides, the number of people who are underweight had decreased by 2015.
- These bar charts compare the assessment of the weight of Charlestown population in the years 1955 and 2015.
- It is clear that ideal people accounted for the large majority of the most age range in both years.
- Besides, the number of people who are underweight had decreased by 2015.
- A detailed look at the charts reveals that the youngest age range remained the highest proportion of ideal people, around 70% in two years .
- In 1955, there were negligible (missing words) obese (missing word) , however, this range of weight rose rapidly over the period of 60 years.
Get the Weekly English Kit 📬
New words, one handy idiom, and a 2-minute quiz — delivered to your inbox to keep your streak alive.
These bar charts compare the assessment of the weight of Charlestown population in the years 1955 and 2015.
It is clear that ideal people accounted for the large majority of the most age
 Related Questions