
Please advise me on Ielts Writing Task 1
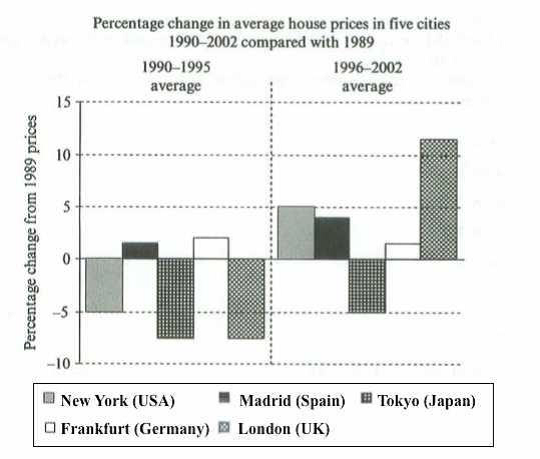
The bar chart compares the figures of five different cities in terms of changes in mean house prices over a period of 13 years from 1989.
It is clear that there was a general fall in house prices from 1990 and 1995, but house prices of most cities rose between 1996 and 2002. London saw by far the most dramatic change in costs of houses over the period shown.
A detailed look reveals that the average cost of houses in London, which fell by approximately 7% after 5 years after 5 years since 1989, saw a significant rise by over 11% over the next period. Likewise, New York saw a moderate decline from 1990 to 1995, and a marked rise between 1996 and 2002 in house prices, by precisely 5% over both periods.
The house prices in Madrid and Frankfurt increased slightly over the first period by over 1%. Over the second period, while the house prices in Madrid still continued to go up by 4%, the house prices in the city of Germany decreased gradually by roughly 1.5%. Similar to London, Tokyo was the country having the greatest decrease in house costs from 1990 to 1995, by 7%, then the costs in average house prices dropped less considerably from 1996 to 2002, by exactly 5%.
Top answer
The bar chart compares the figures from five different cities in terms of changes in mean average house prices over a period of 13 years from 1989 . It is clear that There was a general fall in house prices from 1990 and 1995, but house prices in most cities rose between 1996 and 2002. London saw by far the most dramatic change in costs of houses over the period shown.
- The bar chart compares the figures from five different cities in terms of changes in mean average house prices over a period of 13 years from 1989 .
- It is clear that There was a general fall in house prices from 1990 and 1995, but house prices in most cities rose between 1996 and 2002.
- London saw by far the most dramatic change in costs of houses over the period shown.
- ) since 1989, saw a significant rise of over 11% over the next period.
- Likewise, New York saw a moderate decline from 1990 to 1995, and a marked rise between 1996 and 2002 in house prices, by precisely 5% over both periods.
Get the Weekly English Kit 📬
New words, one handy idiom, and a 2-minute quiz — delivered to your inbox to keep your streak alive.
The bar chart compares the figures from five different cities in terms of changes in mean average house prices over a period of 13 years from 1989.
It is clear that There was a general fall in house prices from 1990 and 1995, but house prices in most c
 Related Questions