
Online sales for retail sectors in Canada
A glance at two pie charts provided reveals how different the online merchandising factors change over the time from 2005 to 2010 in Canada.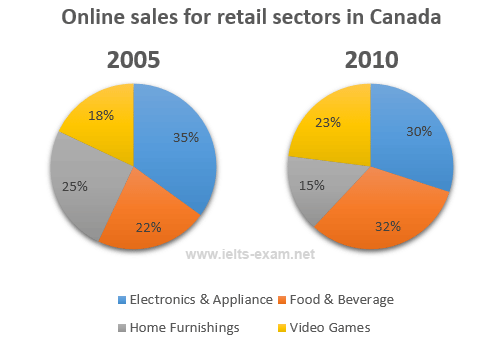
Overall, the sales from electronic and applications was the most significant part. Respectively, home furnishings and food and beverage stand at the second. Lastly, video game ended up the two charts with the lowest contribution.
Clearly, the electronic and applications was the best seller in both years, at 35% in 2005 and a slightly lower 30% in 2010. Likewise, home furnishings which was the second most widely popular pastime in 2005 - accounting for 25% - to slipped to a mere 15% in 2010.
The sales from food and beverage which was 22% in 2005 experienced 10% increase in only five years later. Also, the video games put into food and beverage 's shoes. This figure jumped steeply from 18% to 23% and became the third most seller in 2010.
Top answer
htm Please do not put the essay instructions in the "Subject" line. Put it with your answer in the message body. Subject: Please review my IELTS essay Message body: Topic: Online sales for retail sectors in Canada (This is a noun phrase, not the usual IELTS instructions.
- htm Please do not put the essay instructions in the "Subject" line.
- Put it with your answer in the message body.
- Subject: Please review my IELTS essay Message body: Topic: Online sales for retail sectors in Canada (This is a noun phrase, not the usual IELTS instructions.
- )
Get the Weekly English Kit 📬
New words, one handy idiom, and a 2-minute quiz — delivered to your inbox to keep your streak alive.
Please post essays in the essay forum:
https://www.englishforums.com/English/EssayReportCompositionWriting/Forum9.htm
Please do not put the essay instructions in the "Subject" line.
Put it with your answer in the message body.
You did not carefully look at the data on these pie charts. You made many factual errors in your essay.
A glance at (Those words do not describe the figure. Avoid expressions that do not describe it. They are wasted words.) The two pie charts provided
 Related Questions