
Need a review for my IELTS Writing Task 1
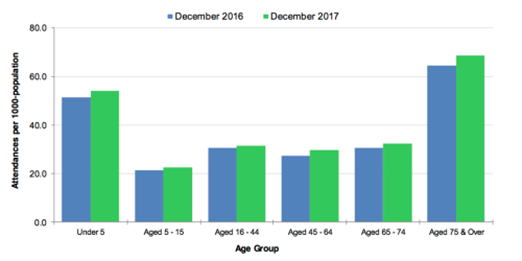
The chart below shows figures for attendances at hospital emergency care departments in Northern Ireland by age group in December 2016 and December 2017.
Attendances at emergency care departments per 1000-population
The given bar chart provides data about the age profile of patients at hospital emergency departments in Northern Ireland in December of 2016 and 2017.
As can be seen clearly that the attendances were absolutely dominated by the oldest and the youngest age groups. Patient numbers saw an accordingly upward trend in both two years in question.
In terms of the 75 and over age bracket, the figures started at roughly 65 people per 1000-population. This was followed by a marginal increase to just under 70 in the year 2017, leading to the highest point of attendances during the whole period. Meanwhile, the number of the 65 to 74 year-olds rose to around 32, which is nearly half of the corresponding figure for the 75 and over year-old people.
If we look at the details, the second greatest number belonged to those children who aged under 5 years old, with the figures rising slightly from 50 to approximately 52 in two separate years. By contrast, the 5-15 age range was named as the lowest rate, standing at just above 20 out of 1000. A slight rise was also seen in the number of patients aged 16 to 44 and aged 45 to 64, by close to 1 and 2 per cent respectively.
Top answer
The given bar chart provides data about the age profile (wrong form) of patients at hospital emergency departments in Northern Ireland in December of 2016 and 2017. As can be seen clearly that T he attendances were absolutely dominated by the oldest and the youngest age groups. Patient numbers saw an accordingly upward trend in both of the two years in question .
- The given bar chart provides data about the age profile (wrong form) of patients at hospital emergency departments in Northern Ireland in December of 2016 and 2017.
- As can be seen clearly that T he attendances were absolutely dominated by the oldest and the youngest age groups.
- Patient numbers saw an accordingly upward trend in both of the two years in question .
- In terms of the 75 - and - over age bracket, the figures started at roughly 65 people per 1000-population.
- This was followed by a marginal increase to just under 70 in the year 2017, leading to the highest point (wrong word) of attendances during the whole period.
Get the Weekly English Kit 📬
New words, one handy idiom, and a 2-minute quiz — delivered to your inbox to keep your streak alive.
The given bar chart provides data about the age profile (wrong form) of patients at hospital emergency departments in Northern Ireland in December of 2016 and 2017.
As can be seen clearly that The attendances were absolutely dominated by the oldest and the youngest age groups. Patient numbers sa
Can you evaluate if this fashion of writing is correct?
The following illustration describes the attendance (per 1000 – population) at hospital emergency department in Northern Ireland of different age groups from December 2016 to December 2017. The chart confirms that there is an increase in the attendance across all the age groups from December 2016 to December 2017.
Cl
 Related Questions