
My writing task 1: The expenditure on fast food
The bar chart compares the spending on fast food in the UK in 1990 from three groups: high income, average income, and low income. Units are million.
Overall, while hamburger was popular to high income and average income group, people who have low income prefer to have fish and chips for their meals.
In 1990, hamburger was consumed mostly by the high-income group, at over 40 while the expenditure on hamburger of average earning group was around 30. Pizza came as second in the expenditure of the high-income group, about 2 times more than that of the middle class. Fish and chips were more attractive to the average income than the high earning group. It stood at 25 in the consumption of average income but only 16 in that of the high-income group.
Fish and chips were the most popular fast food at the low earning group. The spending on this food reached 16 million, was the same as the consumption of it by the upper class. However, the expenditure on hamburger and pizza of working-class was both the lowest, at 14 and just over 5 respectively.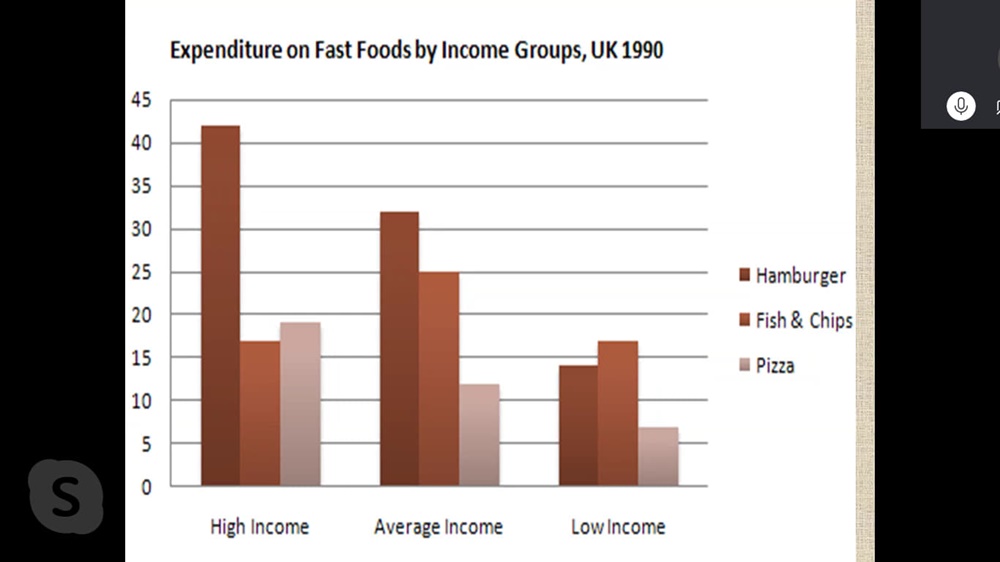
Top answer
The wording is rather awkward. Do not use synonyms which might have different meanings of the groups in the bar chart. The bar chart compares the spending on fast food in the UK in 1990 by from three groups: high income, average income, and low income.
- The wording is rather awkward.
- Do not use synonyms which might have different meanings of the groups in the bar chart.
- The bar chart compares the spending on fast food in the UK in 1990 by from three groups: high income, average income, and low income.
- Units are million.
- (Million what?
Get the Weekly English Kit 📬
New words, one handy idiom, and a 2-minute quiz — delivered to your inbox to keep your streak alive.
The wording is rather awkward. Do not use synonyms which might have different meanings of the groups in the bar chart.
The bar chart compares the spending on fast food in the UK in 1990 by from three groups: high income, average income, and low income. Units are million. (Million what? Dollars? Euros? Pounds?)
Ove
Model essay with minimal repetition:
The bar chart compares the spending on three kinds of fast food (hamburger, pizza and fish & chips) in the UK by income group. There are three income groups: high, average and low. Data is from 1990 and given in millions of pounds.
People with high incomes spent much more than the other two groups, a total of 84 million pounds.
 Related Questions