
My writing task 1 (bar chart)
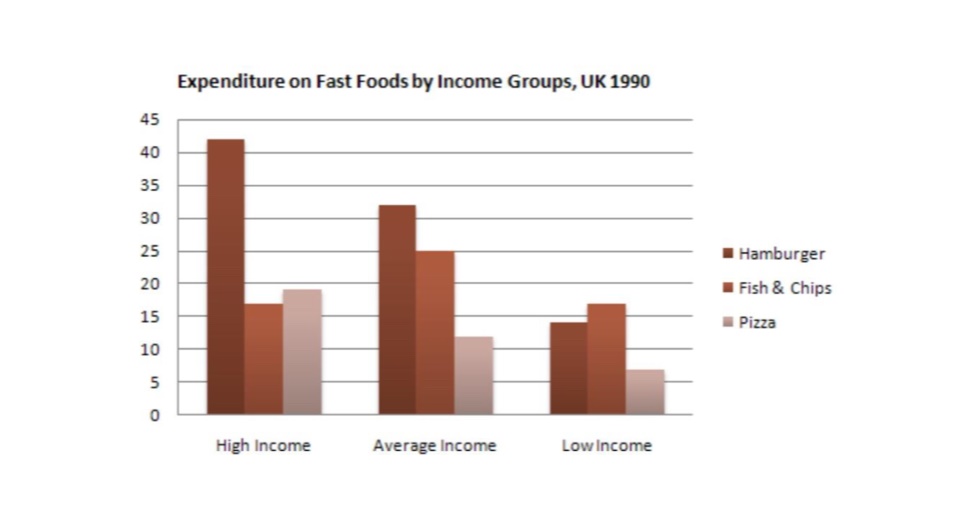
The clustered bar chart gives the total of amounts of expenditure on fast foods-hamburger, fish& chips, pizza by three income groups in UK in 1990. These were high income, average income and low income.
Overall, the rich spent most money for hamburger and pizza in contrast to the poor, which had the lowest expenditure on two types of fast foods. The spending in fish & chips was highest in the average income. The ordering (high income, average income, low income) was not consistent with fish & chips.
In detail, the high income spent more than three times as the low income for hamburger, 42 versus 14 pence. Regarding fish & chips, the value for the rich was approximate to one for the poor, with about 17 pence. The expenditure by the average income was in the first place, at 25 pence. For pizza, the sum of the spending by average income and low income, with about 12 and 5 pence respectively, was equal to the expenditure by the high income.
Get the Weekly English Kit 📬
New words, one handy idiom, and a 2-minute quiz — delivered to your inbox to keep your streak alive.
 Related Questions