
MY TASK 1 pls help me
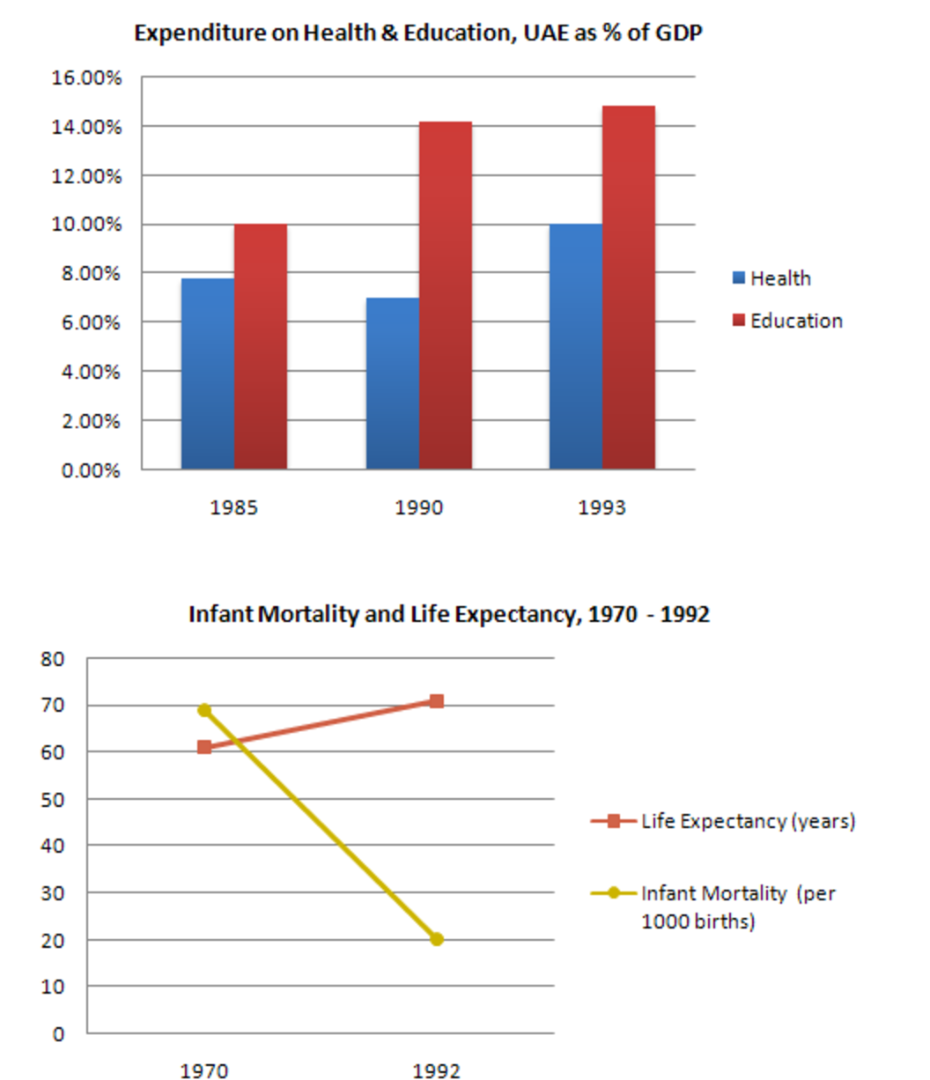
The given graph show percentage of GDP which spent on health and education in UAE from 1985 to 1993 and the infant mortality and life expectancy of this country from 1970 to 1992. Overall, people in UAE tend to spend more in Education than health in the 90s. Meanwhile, the number of infant mortality decreased significantly from, while the percentage of the life expectancy rose up slightly from 1970 to 1992.
As it illustrated in the first chart, the number of spending on heath was started at 10.10% on 1985, and increased to 14% and reached nearly 16% from 1990 to 1993, respectively. On the other hand, the health charts were shorter than the education part, it begun with nearly 8.00% and declined slightly to about 7% in 1990 and went up boomly to 1% in 1993.
According to the second graph, life expectancy in UAE was 60 years initially in 1970 while the infant mortality rate was 70 per thousand. After 22 years, both of these situations improved and the life expectancy of UAE people increased to 71 years while the infant mortality rate decreased to only 20 per thousand.
Top answer
I have highlighted the text that has mistakes, and needs to be changed. The given graph show (missing word) percentage of GDP which spent (wrong form) on health and education in (missing word) UAE from 1985 to 1993 and the infant mortality and life expectancy in this country from 1970 to 1992. Overall, people in (missing word) UAE tend to spend more in E ducation than health in the 90s.
- I have highlighted the text that has mistakes, and needs to be changed.
- The given graph show (missing word) percentage of GDP which spent (wrong form) on health and education in (missing word) UAE from 1985 to 1993 and the infant mortality and life expectancy in this country from 1970 to 1992.
- Overall, people in (missing word) UAE tend to spend more in E ducation than health in the 90s.
- Meanwhile, the number of infant mortality decreased significantly from, while the percentage of the life expectancy rose up slightly from 1970 to 1992.
- 10% on 1985, and increased to 14% and reached nearly 16% from 1990 to 1993, respectively.
Get the Weekly English Kit 📬
New words, one handy idiom, and a 2-minute quiz — delivered to your inbox to keep your streak alive.
I have highlighted the text that has mistakes, and needs to be changed.
The given graph show (missing word) percentage of GDP which spent (wrong form) on health and education in (missing word) UAE from 1985 to 1993 and the infant mortality and life exp
 Related Questions