
My post
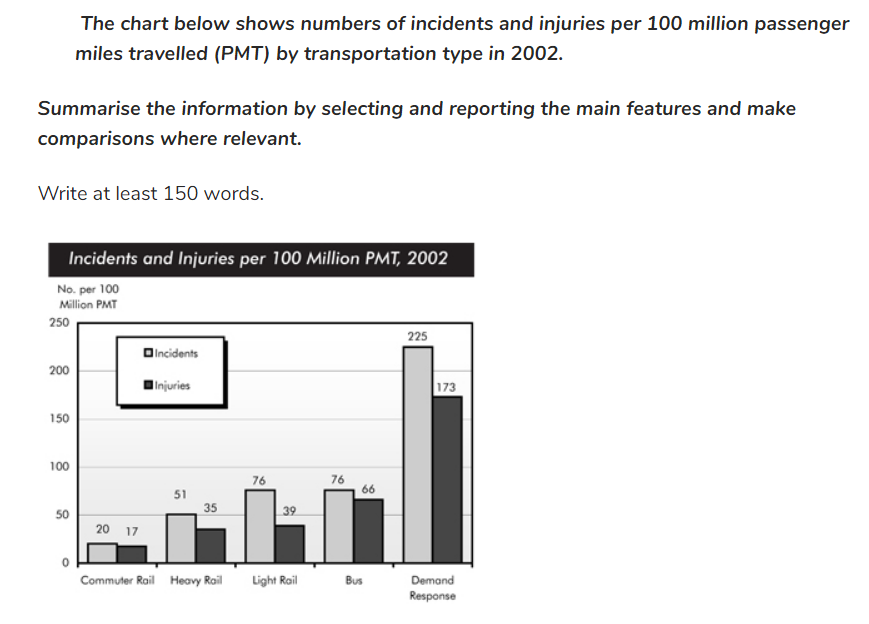
The chart compares how many incidents and injuries occured in five transportation types in 2002. The units are measured in 100 million passenger miles traveled (PMT).
Overal, what stand out from the graph is incidents always outnumbered injuries in all five transportation types. It is clear that the number of people who were injuried and met accident on demand-responsible vehicles made up the largest proportion at all. Whereas, on commuter rail, this figures were the lowest
When people used demand-responsible vehicles, a total of 225 incidents and 173 injuries per 100 million PMT arose. They were recorded nearly three times as high as those for the second category, the bus services which only had 76 incidents and 66 injuries. By contrast, all 3 sort of rail services experienced quite few problems. Despite the Light rail services and buses had the same the rate of incidents (76 cases per 100 million PTM), the rest of Commuter rail, Heavy rail and Light rail's injuries made up a very small part, specially there were only 20 incident and 17 injuries took place on Commuter rail.
Top answer
The chart compares how many incidents and injuries occured in five transportation types in 2002. The units are measured in numbers per 100 million passenger miles traveled (PMT). Overal , what stand (subject-verb mismatch) out from the graph (This is an opinion.
- The chart compares how many incidents and injuries occured in five transportation types in 2002.
- The units are measured in numbers per 100 million passenger miles traveled (PMT).
- Overal , what stand (subject-verb mismatch) out from the graph (This is an opinion.
- ) is incidents always outnumbered injuries in all five transportation types.
- It is clear that (Just describe the chart.
Get the Weekly English Kit 📬
New words, one handy idiom, and a 2-minute quiz — delivered to your inbox to keep your streak alive.
The chart compares how many incidents and injuries occured in five transportation types in 2002. The units are measured in numbers per 100 million passenger miles traveled (PMT).
Overal, what stand (subject-verb mismatch)
 Related Questions