
My new writing task 1 of the IELTS
Hey, i've just completed new writing. I hope that you all can help me check some mistakes I have made as I have learned to do this task myself ^^
The graph below shows the annual number of rides taken on two forms of public transportation in the city of Williamsville.
Summarise the information by selecting and reporting the main features, and make comparisons where relevant.
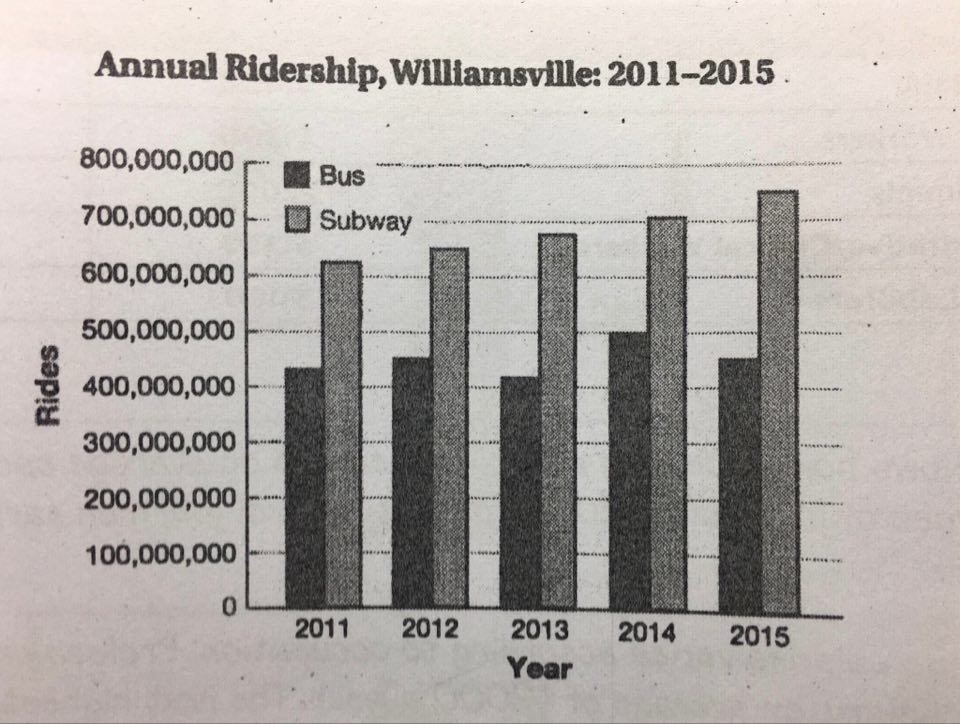
The graph compares how many rides taken on two modes of transportation: bus and subway in Williamsville in the period between 201 and 2015.
Overall, the annual number of rides taken by bus went up and down while subway ridership rose stably from 2011 to 2015. Bus rides were always significantly lower than those of the subway.
The annual rides taken by bus varied during the 5-year period. In 2011, annual bus ridership was a little more than 400.000.000. This number rose significantly to around 450.000.000 rides in 2012 before a drop to the lowest point of just more than 400.000.000 in 2013. Following that, the number of bus rides surged to 500.000.000, which is the highest, in 2014. Then it dropped to the same point as in 2012, with around 450.000.000 rides.
In term of the subway, there witnessed a stable increase during the same period. In 2011, a little above 600.000.000 subway rides were taken. The number rose moderately to about 650.000.000 rides in 2012 and continued its upward trend until 2015. It was when the figure reached its peak with about 750.000.000 rides taken.
Thank you all for helping me. <3
Get the Weekly English Kit 📬
New words, one handy idiom, and a 2-minute quiz — delivered to your inbox to keep your streak alive.
 Related Questions