
My IELTS Writing Task 1. Please help me check this essay
The bar chart illustrates the data on the numbers (in thousand) of students who opt for studying different university subjects in 2005. The survey shows a marked difference between the male's and female's tendency of pursuing their academic areas to study. It is noticeable that while the portion of males dominated in those fields related to sciences profession, the portion of females were keen on the other social subjects.
As shown in the chart, of the eight items, the men tended to prioritize the science and mathematics subject with the exceptional proportion (22.000 and 18.000 male student) in 2005. The most significant feature the chart demonstrates is that the calculation subjects seemed to be chosen by the male students rather than female students. By contrast, the most popular choices which were predominant by female students were non-science subjects in which appealed 25.000 of them to participate in social sciences subjects. Besides, many non-techinical subjects such as languages, literature and humanities attracted a large number of students choosing.
Apart from these popular subjects above, there are many subjects that very few male students choose to study. It can be easily seen that in languages subjects, only 2000 of male students compared to 18.000 female students. The same thing happened in the circumstance of the arts whereas almost no men engaged in this subjects, the figures for females were doubles that of male (at nearly 9000 students). Similarly, the humanities had the same number of students between male and female who were interested in (around 11.000 students).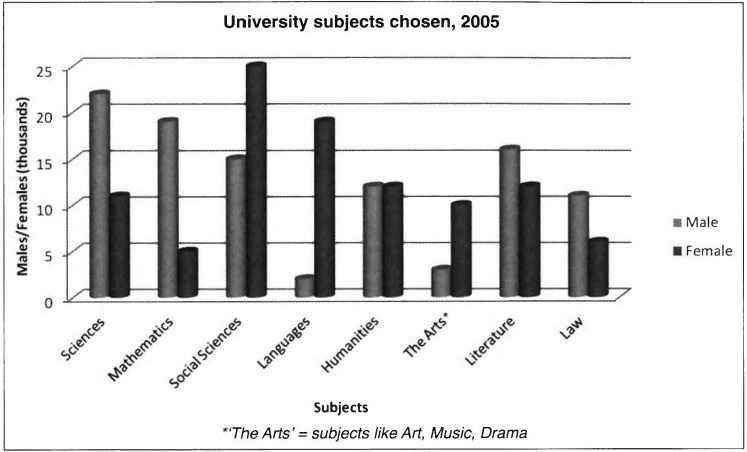
Top answer
I have highlighted the text with mistakes. The bar chart illustrates plots (Illustrate means to draw a picture of. ) the data on the numbers (in thousand ) of students who opt (wrong form) for studying different university subjects in 2005.
- I have highlighted the text with mistakes.
- The bar chart illustrates plots (Illustrate means to draw a picture of.
- ) the data on the numbers (in thousand ) of students who opt (wrong form) for studying different university subjects in 2005.
- The survey shows a marked difference between the male's and female's tendency of pursuing (that is not what the chart shows) choices of their academic areas to study.
- It is noticeable that while the portion of males dominated in those fields related to the sciences profession , the (missing word) portion of females were keen on the other (science is not a social subject) social subjects .
Get the Weekly English Kit 📬
New words, one handy idiom, and a 2-minute quiz — delivered to your inbox to keep your streak alive.
I have highlighted the text with mistakes.
The bar chart illustrates plots (Illustrate means to draw a picture of. ) the data on the numbers (in thousand) of students who opt (wrong form) for studying different university subjects in 2005. The survey shows a
 Related Questions