
Marriages in America
Topic: The chart below shows the number of marriages and divorces in the USA from 1970 to 2000 and marital status of adult Americans in 1970 and 2000 Summarise the information by selecting and reporting the main features, and make comparisons where relevant
My essay:
The first bar chart describes the quantity of marriages and divorces in the USA from 1970 to 2000. At the same period of time, the second bar chart illustrates the proportion of marital status of adult American. Overall, the number of people getting married is enormously higher than divorcing and the percentage of people having married status is significantly higher than other categories.
In 1970, there were 2.5 million American marriages and still remained that number in 1980. In the next 20 years, the firgues decreased slightly by 5 million. As for divorces,from 1 millions in 1970, the firgues accelerated moderately to approximately 1.4 million before reducing steadily back to 1 million in 2000.
The rate of American who never married in 1960 was lower than in 2000, by about 5%. This percentages were revealed clearer in people that maried. To make it obvious, the firgue in 1970 was higher than in 2000 by 10%. About widow, it accounted for a small portion of summary as it dropped nearly 1% in the period of 30 years begins with 1970. In the opposite curcumstances with widowing, the proportion of people divorcing rose gradually from 2% to 9%.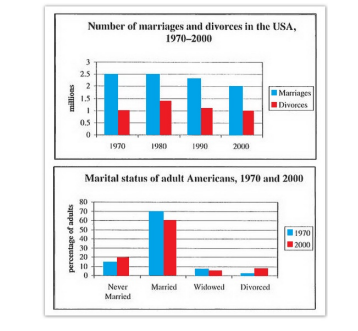
Top answer
I've highlighted some mistakes from your text. Try to fix them, and post the revised essay below. -------------------------------------------------------------------- The first bar chart describes the quantity of marriages and divorces in the USA from 1970 to 2000.
- I've highlighted some mistakes from your text.
- Try to fix them, and post the revised essay below.
- -------------------------------------------------------------------- The first bar chart describes the quantity of marriages and divorces in the USA from 1970 to 2000.
- At the same period of time, the second bar chart illustrates the proportion of marital status of adult America n .
- Overall, the number of people getting married is enormously higher than divorcing and the percentage of people having married status is significantly higher than other categories.
Get the Weekly English Kit 📬
New words, one handy idiom, and a 2-minute quiz — delivered to your inbox to keep your streak alive.
I've highlighted some mistakes from your text. Try to fix them, and post the revised essay below.
--------------------------------------------------------------------
The first bar chart describes the quantity of marriages and divorces in the USA from 1970 to 2000. At the same period of ti
 Related Questions