
Mark my task 1 please
essay goes here
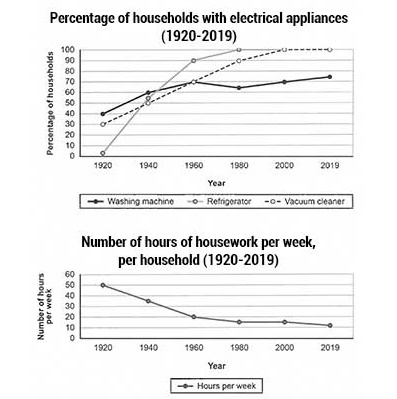
The given line graphs depict how electronic devices used by households along with the amount of time spent doing household chores in a nation from 1920 to 2019.
Overall, it can be clearly seen that washing machines, fridges, and vacuum cleaners experienced upward trends, while the number of doing chores hourly witnessed a downward trend.
As we can see, the proportion of households using a fridge underwent a drastic climb from 0 to 90% between 1920 and 1960, followed by a moderate growth to 100%. It remained constant at 100% from 1980 to the end of the period. After that, there was a phenomenal increase in the percentage of vacuum cleaners used from exactly 30 to 100%. By the end of the year, it underwent a plateau at 100%. The percentage of machines used for washing experienced a slight upward change between 40 and 70%, then followed by a small decline to well above 60%. The last year saw a moderate growth to well under 80%.
Household duties spent by owners over weeks witnessed a significant decrease from 50 all the way down to 10% from 1920 to the end of the period.
Get the Weekly English Kit 📬
New words, one handy idiom, and a 2-minute quiz — delivered to your inbox to keep your streak alive.
 Related Questions