
Mark my task 1
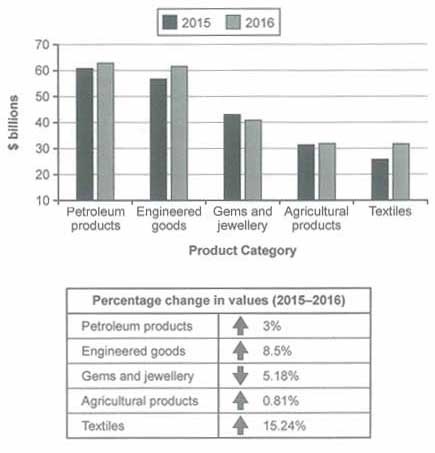
The chart below shows the value of one country’s exports in various categories during 2015 and 2016. The table shows the percentage change in each category or exports in 2016 compared with 2015.
essay here
The given bar chart reveals the valuable exports of a nation in different sectors between 2015 and 2016, while the table depicts the change in the percentage of each category of transports from the same year 2015 and 2016.
Overall, it can be clearly seen that the smallest percentage change was the gems and jewelry, while both petroleum products and engineered goods had the highest percentage of the export income in 2016.
As we can see, petrol products climbed slightly from high above 60 to 62 billion dollars and went up to 3% from 2015 to 2016. Goods in engineering saw a moderate change from 58 to well above 60 billion at 8,5% between 2015 and 2016. Gems and jewelry experienced a slight downturn at 5,18% and from 42 to about 40 billion dollars. Agricultural products grew to a small 0,81%, followed by textiles, which increased slightly from about 30 to well above 30 billion dollars and the percentage was 15,24% between 2015 and 2016.
Top answer
Please read my advice for Task 1 essays: IELTS TASK 1: Hints, Tips And Advice Vocabulary Words For Task 1: Reference Post
- Please read my advice for Task 1 essays: IELTS TASK 1: Hints, Tips And Advice Vocabulary Words For Task 1: Reference Post
Get the Weekly English Kit 📬
New words, one handy idiom, and a 2-minute quiz — delivered to your inbox to keep your streak alive.
The given bar chart reveals (not a good word choice) the valuable exports (That is not accurate. What is the y-axis scale?) of a nation in different (How many? What are they?) sectors (wrong word) between 2015 and 2016, while the table depicts the ch
Example
The bar graph gives the export value of five categories of goods (petroleum goods, engineered goods, gems and jewellery, agricultural products, and textiles) for a country in 2015 and 2016. The table lists the year-over-year percentage changes calculated from the numbers given in the bar graph.
Overall, in 2015, the category with the highest value was petro
 Related Questions