
Mark my task 1
The given pie charts reveal the average percentages in specific meals of three different kinds of nutrients such as sodium, saturated fat, and sugar of US people which are not healthy if consumed a large amount of it.
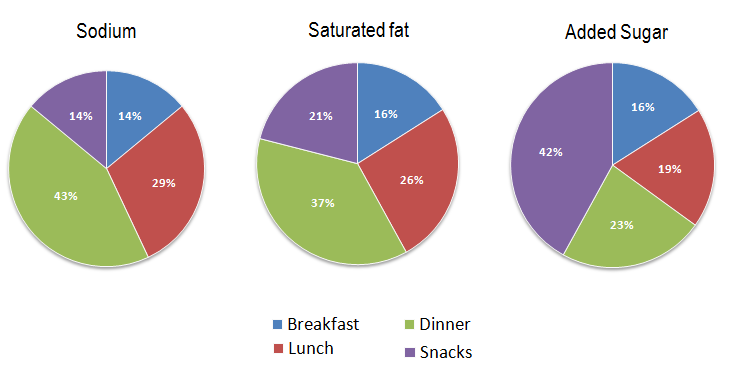
Overall, it can be clearly seen that sodium dinner has the highest nutritional value in meals, while the percentage of sodium in breakfast is the lowest.
As we can see, dinner with sodium made up 43% while the percentage of saturated fat food and sugary food accounted for 37% and 23% respectively. Also, a modest 29% is sodium lunch, while saturated fat in lunch is 26% and sugar in lunch is 19%.
However, there is a modest 16% in both breakfast including fat and sugar, whereas a mere 14% of sodium is consumed in breakfast. A hefty 42% of sugar is used in snacks, while sodium and saturated fat in snacks only constituted 14% and 21% in both categories respectively.
Top answer
Please read my advice for Task 1 essays: IELTS TASK 1: Hints, Tips And Advice Vocabulary Words For Task 1: Reference Post
- Please read my advice for Task 1 essays: IELTS TASK 1: Hints, Tips And Advice Vocabulary Words For Task 1: Reference Post
Get the Weekly English Kit 📬
New words, one handy idiom, and a 2-minute quiz — delivered to your inbox to keep your streak alive.
Please read my advice for Task 1 essays:
The given (How many?) pie charts reveal (poor word choice) the average percentages in specific meals (wrong placement) of three different kinds of nutrients such as (wrong expression. "Such as" means the list is incomplete and you are
Here are different ways to describe the figure in an opening paragraph.
1.
Three pie charts, one each for sodium, saturated fat, and added sugar, break down the percentage of that nutrient that is consumed, on average, in each of the four daily meals. This data is from the average American diet which consists of breakfast, lunch, dinner, and in-between meal snacks.
 Related Questions