
Line graph - IELTS task 1. Any correction would be much appreciated.
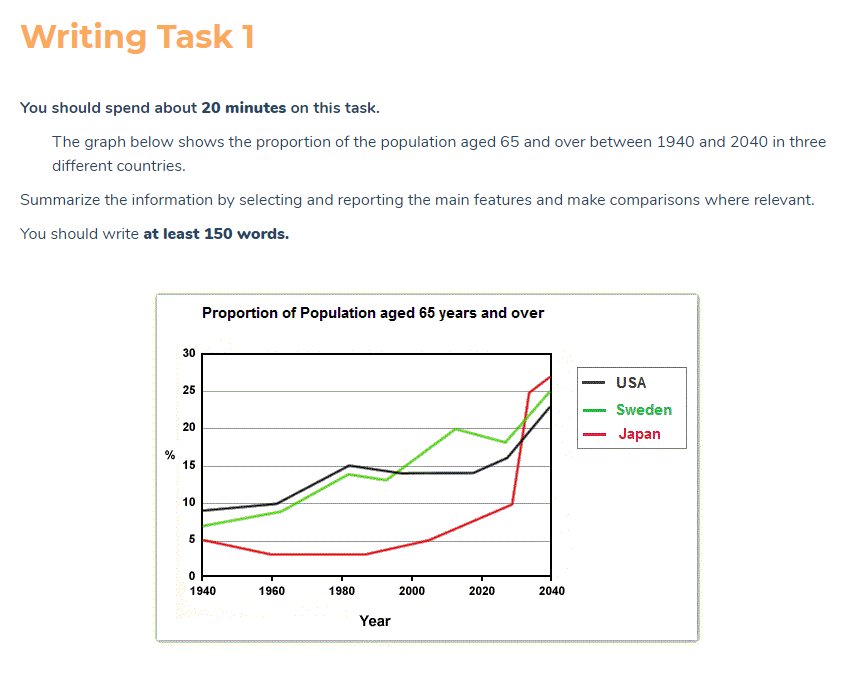
The line graph illustrates the percentage of population over 65 years of age in 100 years from the year 1940 in the USA, Sweden, and Japan.
Overall, while the USA and Sweden experienced a steady increase in the proportion with some minor fluctuations at some points of time, Japan's figures have a slight drop at the start and grow gradually with the expectation of surpassing the other two nations in the future.
The two Western countries shared similar patterns until 1995s, in which Sweden's number rose while that of the USA continued to fall to just under 15% in 2000. The percentage of the USA remained steady for a period before starting to increase before 2020 and is forecasted to reach 23% in 2040, 2% lower than Sweden's number in the same year.
Japan, however, had a drop in 1960 and had its figure frozen before the 1990s. After that, it began to move up, reaching 10% in the 2030s and is predicted to skyrocket to just under 28% in 2040, making it the country with the highest elderly rate among the three.
Top answer
Please read my advice for Task 1 essays: IELTS TASK 1: Hints, Tips And Advice Vocabulary Words For Task 1: Reference Post
- Please read my advice for Task 1 essays: IELTS TASK 1: Hints, Tips And Advice Vocabulary Words For Task 1: Reference Post
Get the Weekly English Kit 📬
New words, one handy idiom, and a 2-minute quiz — delivered to your inbox to keep your streak alive.
Please read my advice for Task 1 essays:
The highlighted words and phrases are unnatural or incorrect. Read my advice for the best outline and vocabulary words in Task 1.
The line graph illustrates the percentage of population over 65 years of age in 100 years from the year 1940 in the USA, Sweden, and Japan.
Overall,
 Related Questions