
Line graph - Ielts task 1
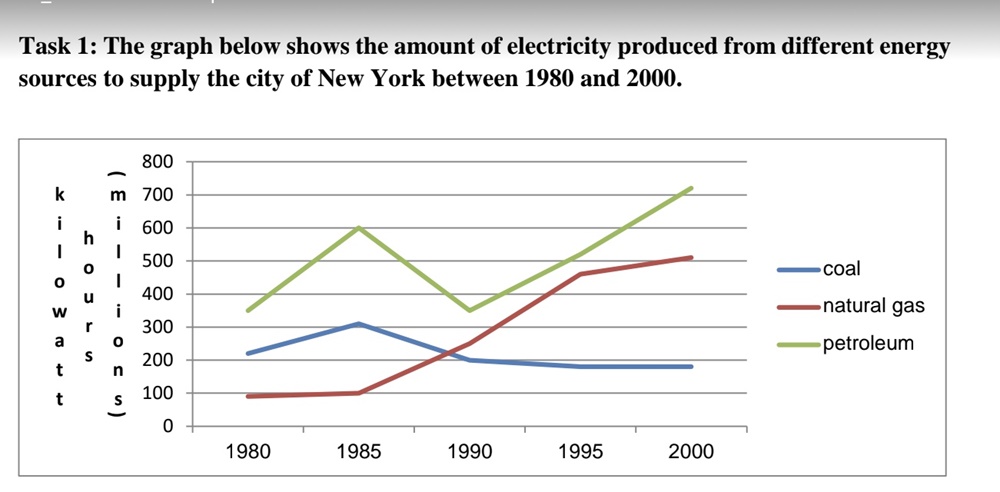
The line graph compares the quantity of electricity manufactured from coal, natural gas, and petroleum to provide for the town of New York from 1980 to 2000.
Overall, petroleum is an energy source that was mostly used to create electricity for a city of New York over the period of 20 years, whereas electricity production of natural gas production was the lowest in the former 10 years. However, the amount of electricity created by natural gas had surpassed that by coal for the latter 10 years.
In 1980, 350m k/h of the electricity was manufactured by petroleum, followed by about 210m k/h of coal and roughly 98m k/h of natural gas. Over the 5 following years, the amount of electricity production from natural gas remained relatively stable, while there were increases of electricity manufacture from coal and petroleum to roughly 310m k/h and about 600m k/h respectively.
Additionally, the amount of electricity manufactured from petroleum considerably increased from 100m k/h in 1990 to approximately 480m k/h in 1995, and continuously increased steadily to about 502m k/h at the end of the period. In contrast, by 1990, the quantity of electricity production by coal and petroleum had significantly decreased to 360m k/h and 200m k/h respectively. Ultimately, there was a rise again to 710m k/h of the amount of electricity created from petroleum between 1990 and 2000, whereas that produced from coal continued to decline slightly to 190m k/h.
this is the second essay about line graph I wrote after reading your advise in desperate. Hopefully, my essay would be improved somewhat. However, I still find myself struggling to summarize the subjects (I wrote them repeatedly  ). Thank you so much!!!
Get the Weekly English Kit 📬
New words, one handy idiom, and a 2-minute quiz — delivered to your inbox to keep your streak alive.
 Related Questions