
Line graph
Please review my essay!
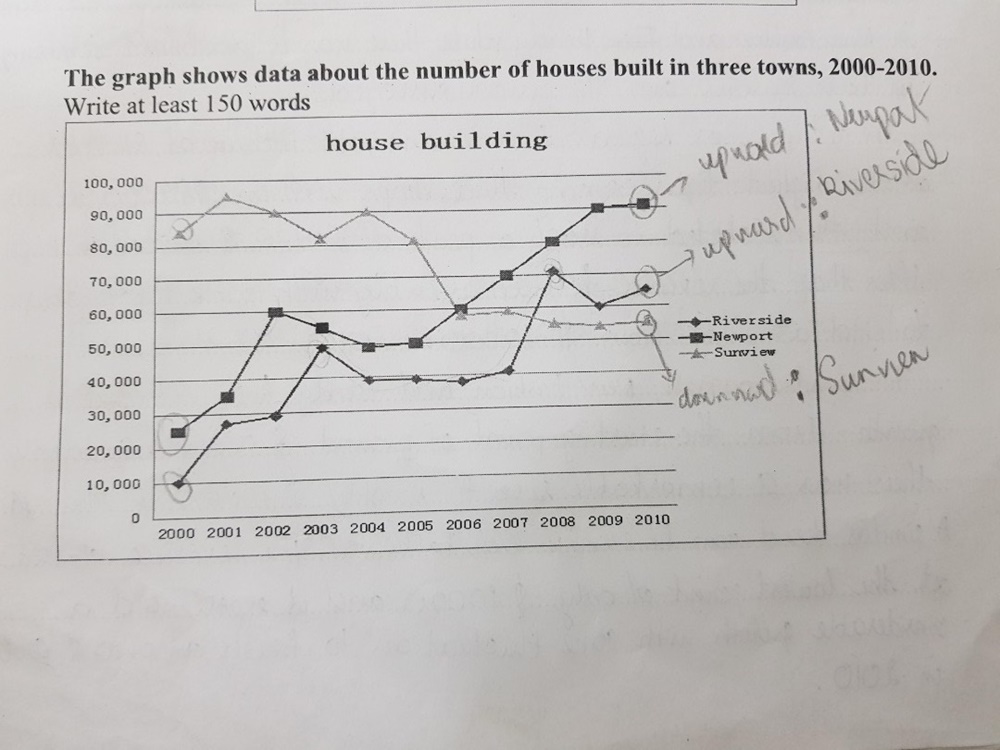
The line chart compares the number of residents in three towns which were constructed between 2000 and 2010.
Overall, it can be clearly seen that there was a downward trend in Sunview while Riverside and Newport both witnessed a growth.
In detail, the house building in the Sunview starting at the highest point among three towns with over 80000 in 2000. Then, the figure rose slightly to peak at under 100000 in 2001, before declining significantly with some fluctuations to end up at 90000 in 2010.
In contrast, by 2000 in Newport, just over 20000 houses were built in 2000, but it increased remarkably to 60000 in the two following years. Suddenly, the figure fell moderately before rocketing to peak at 90000 in 2010. Likewise, Riverside starting at the lowest point of only 10000 houses were constructed, however, it shooting up with some fluctuations to reach a peak at 70000 in 2008 but fell back suddenly in the following years before recovering a half to end up at more than 60000 in 2010.
Top answer
The line chart compares the number of residents (That is the number of people who live in the towns. ) in three towns which were constructed between 2000 and 2010. (That means these towns did not exist before 2000.
- The line chart compares the number of residents (That is the number of people who live in the towns.
- ) in three towns which were constructed between 2000 and 2010.
- (That means these towns did not exist before 2000.
- ) Oh dear, that is not what is on this line graph.
- You wrote that there were three new cities.
Get the Weekly English Kit 📬
New words, one handy idiom, and a 2-minute quiz — delivered to your inbox to keep your streak alive.
The line chart compares the number of residents (That is the number of people who live in the towns. ) in three towns which were constructed between 2000 and 2010. (That means these towns did not exist before 2000. In 1999, nobody lived in any of these three towns.)
Oh dear
 Related Questions