
Line Graph - 10th-May-2018 - Thanks for your help
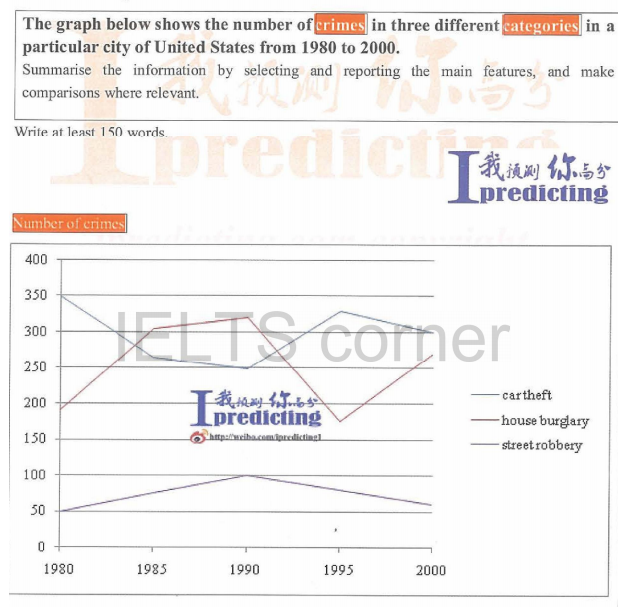
The line graph depicts variations in the quantity of crimes in three different criminal types including car theft, house burglary as well as street robbery in a certain city of the USA throughout a period of 20 years starting in 1980.
Overall, while car theft and house burglary remained the most number of crimes, with their patterns being almost the reverse of each other, street robbery remained by far the least criminal figure over the entire time frame.
In 1980, the criminal number of car theft and house burglary stood at 350 and just under 200 respectively, compared with that of street robbery, with a number of 50.
A twofold increase can be seen in the number of street robbery in 1990. During the same time, although the status of car theft became better, with numbers considerably falling from 350 to 250, the trend of house burglary experienced a steady bounce up to 320. However, after 1992, the number of car theft overtook the one of house burglary and remained the largest even further.
A period between 1995 and 2000 witnessed an exchange in patterns of car theft and house burglary quantities, with the former standing at 300 and the latter standing at 270 in 2000. In addition, the statistics of street robbery, a distant third, ending at just above 50 in 2000.
Top answer
The line graph depicts variations in the quantity number of crimes in three different criminal types including car theft, house burglary and as well as street robbery in a certain city of the USA throughout a period of 20 years starting in 1980. Overall, while car theft and house burglary remained (wrong word; constituted, had ) the most number of crimes, with their patterns being almost the reverse of each other, street robbery remained by far the least criminal figure (lowest) over the entire time frame. In 1980, the criminal number of car theft (wrong form) and house burglary (wrong form) stood at 350 and just under 200 respectively, compared with that of street robbery , (wrong form) with a number of 50.
- The line graph depicts variations in the quantity number of crimes in three different criminal types including car theft, house burglary and as well as street robbery in a certain city of the USA throughout a period of 20 years starting in 1980.
- Overall, while car theft and house burglary remained (wrong word; constituted, had ) the most number of crimes, with their patterns being almost the reverse of each other, street robbery remained by far the least criminal figure (lowest) over the entire time frame.
- In 1980, the criminal number of car theft (wrong form) and house burglary (wrong form) stood at 350 and just under 200 respectively, compared with that of street robbery , (wrong form) with a number of 50.
- A twofold increase can be seen in the number of street robbery (wrong form) in 1990 as compared to 1980 .
- During the same time period , although the status (wrong word) of car theft became better, with numbers considerably falling considerably from 350 to 250, the trend (wrong word) of house burglary experienced a steady bounce up to 320.
Get the Weekly English Kit 📬
New words, one handy idiom, and a 2-minute quiz — delivered to your inbox to keep your streak alive.
The line graph depicts variations in the quantity number of crimes in three different criminal types including car theft, house burglary and as well as street robbery in a certain city of the USA throughout a period of 20 years starting in 1980.
Overall, while car theft and
 Related Questions