
Kelts writing task 1 - Bar chart
 n
n
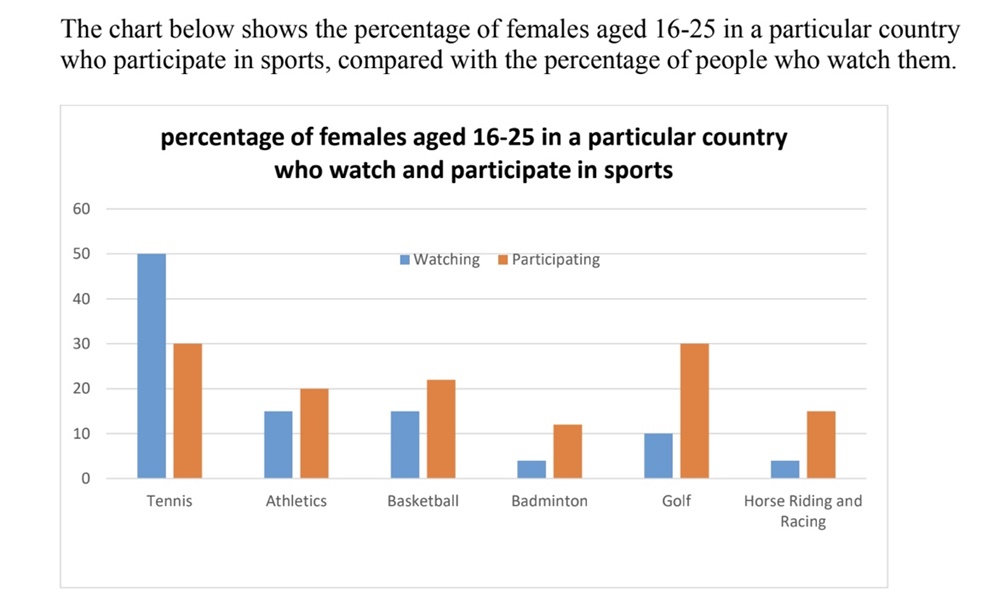
The bar chart illustrates the proportion of women from 16 years old to 25 years old in a specific nation who playing Tennis, Athletics, Basketball, Badminton, Golf, and Horse riding and racing, in comparison with the proportion of audiences watching their matches.
Overall, Badminton and Horse riding and racing saw the lowest proportion of female participants while the percentage of women playing Tennis is the highest. The audiences tend to be the most interested in watching both Tennis and Golf.
The proportion of women playing Tennis reached a peak of 50% while the figure for Golf is less than five times, at just 10%, and a similar percentage of people watching Golf and Tennis matches are the highest with 30%. In terms of Athletics and Basketball, female members of two sports saw the same proportion, just 15%, and the figure for people watching Basketball is higher with about 22%, compared to only 20% of Athletics audiences.
Badminton and Horse riding and Racing have resemblances regarding the lowest percentage of women participants as well as the proportion of people watching them, just 5% and roughly 13% respectively.
Top answer
This essay is flawed. The title of the chart and the instructions are contradictory. This test should be thrown in the trash bin.
- This essay is flawed.
- The title of the chart and the instructions are contradictory.
- This test should be thrown in the trash bin.
- I would use the graphic by itself.
- The bar chart illustrates (Wrong verb) the proportion of women from 16 years old to 25 years old in a specific nation who playing (Ungrammatical verb) Tennis, Athletics, Basketball, Badminton, Golf, and Horse riding and racing, in comparison with the proportion of audiences (Wrong word) watching them.
Get the Weekly English Kit 📬
New words, one handy idiom, and a 2-minute quiz — delivered to your inbox to keep your streak alive.
This essay is flawed. The title of the chart and the instructions are contradictory. This test should be thrown in the trash bin. I would use the graphic by itself.
The bar chart illustrates (Wrong verb) the proportion of women from 16 years old to 25 years old in a specific nation
 Related Questions