
It's my pleasure to read feedbacks from you
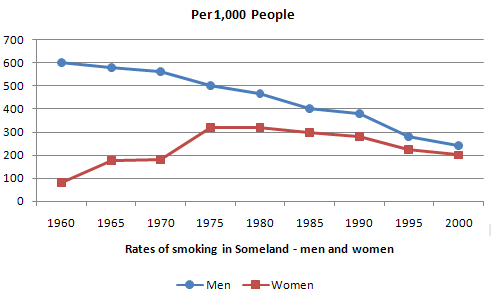
The line graph shows the smoking rates changing in both men and women in Someland between 1960 and 2000.
Overall, the number of male smokers was always higher than females over the whole timeline. However, there were some differences in the two periods of time, from 1960 to 1975 and from 1975 to 2000.
In 1960, the number was 600 men in every 1000 people, while only 100 women were smoking at that time. However, until 1975 this number in men gradually decreased to 500. On the opposite, smoking among women had a slight rise, was over 190 female smokers in 1970 and reached 300 in 1975.
After 1975, smoking in both genders fell generally. The rates in men dropped from 500 in 1975 to 250 in 2000. Similarly, smoking among women also went down slowly between the year 1975 and 1990, was 290 and continuously dropped to 200 by 2000.
Get the Weekly English Kit 📬
New words, one handy idiom, and a 2-minute quiz — delivered to your inbox to keep your streak alive.
 Related Questions