
IETLS writing task 1: sales of games
I'm preparing for the IELTS exam. Can you please review my task 1 essay? Thank you!
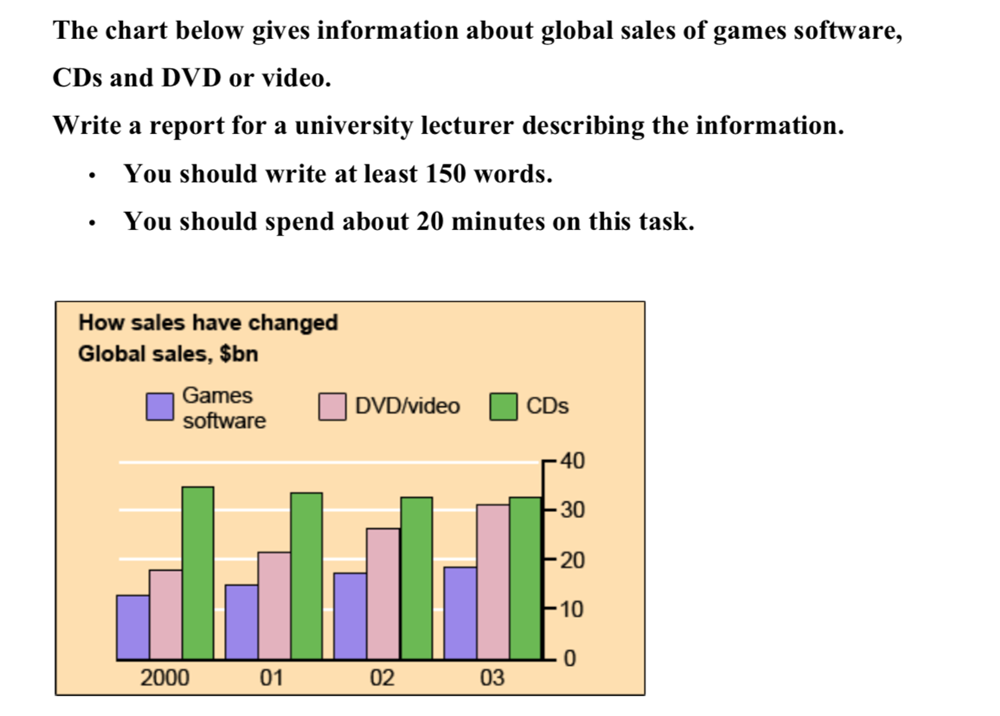
The bar chart illustrates sales of three different items sold worldwide over the course of four years starting in 2000.
Overall, it is clear that sales of games software and DVD/video showed an upward trend over the 4-year period, while CD sales decrease. In addition, CDs had the highest sales over this period of time.
In 2000, the amount of money spent on CDs (close to $34 billion) was the largest. This was followed by the sales of DVD/video ($18 billion), which was nearly a half of CD sales, and game software sales ($13 billion). The year 2002 saw a small decrease of $2 billion in the sales of CDs. By contrast, the figures for games software and DVD/video climb gradually to $18 billion and $26 billion respectively in this year.
While the sales of CDs remained stable at about $32 billion from 2002 to 2003, sales of DVD/video and games software continued to go up, reaching $31 billion and $19 billion respectively. Despite these changes, CD sales were still the highest in 2003.
Top answer
The bar chart illustrates the sales of three different items (CDs, DVDs and gaming software) sold worldwide over the course of four years starting in 2000. The values ranged from $15 billion to $35 billion. Overall, it is clear that the sales of games software and DVD/videos showed an upward trend over the 4-year period, while CD sales decrease d.
- The bar chart illustrates the sales of three different items (CDs, DVDs and gaming software) sold worldwide over the course of four years starting in 2000.
- The values ranged from $15 billion to $35 billion.
- Overall, it is clear that the sales of games software and DVD/videos showed an upward trend over the 4-year period, while CD sales decrease d.
- In addition, CDs had the highest sales values, ranging between 32 and 34 billion, over this period of time.
- In 2000, the amount of money spent on CDs (close to $34 billion) was the largest.
Get the Weekly English Kit 📬
New words, one handy idiom, and a 2-minute quiz — delivered to your inbox to keep your streak alive.
The bar chart illustrates the sales of three different items (CDs, DVDs and gaming software) sold worldwide over the course of four years starting in 2000. The values ranged from $15 billion to $35 billion.
Overall, it is clear that the sales of games software and DVD/videos showed an upward trend over the 4-year period, while CD sales decrea
 Related Questions