
Ietls Writing Task 1: Line Graph
Please help me with my essay. Thank you in advance.
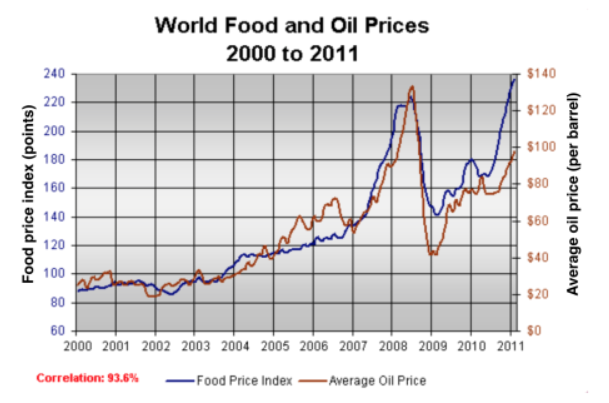
Topic: The graph below shows changes in global food and oil prices between 2000 and 2011.
The line graph depicts information about how food and oil price change during the period 2000-20111. From a brief inspection, both commodities have observed upward trends, which were relatively similar to each other, resulting in a strong correlation index of 93.6%. Although there were some fitful changes in prices of both between 2008 and 2009, both categories still remained their rising momentum until the end of the period.
Prior to 2004, prices for Food and Oil averaged at 90 points and $30 respectively. Since 2004 onwards, both items observed different increasing trend, in which a barrel costed more than double in early 2007 ($70 compared to $30 in 2004), while food price experienced a rise of less than 1.5 times at the same time (130 compared to 90 points).
Subsequently, 2008 saw dramatically climbs in prices of both items, with the data rising nearly double for both Food and Oil. The increases were then followed by remarkable decline, reaching approximately 140 mark and $40 for Food and Oil respectively. Through the end of the period, the two categories continued to grow despite having some marginal drop in prices.
Top answer
The line graph depicts information about (That is very vague and imprecise. What is on the line graph? It is not information about something, it is data values.
- The line graph depicts information about (That is very vague and imprecise.
- What is on the line graph?
- It is not information about something, it is data values.
- ) how food and oil price change during the period 2000- 20111 .
- (In paragraph 1, describe the graph, but not the data.
Get the Weekly English Kit 📬
New words, one handy idiom, and a 2-minute quiz — delivered to your inbox to keep your streak alive.
The line graph depicts information about (That is very vague and imprecise. What is on the line graph? It is not information about something, it is data values. What are these values?) how food and oil price change during the period 2000-20111. (In paragraph 1, describe the graph, but not t
 Related Questions