
IETLS Writing Task 1 - Ask for correction
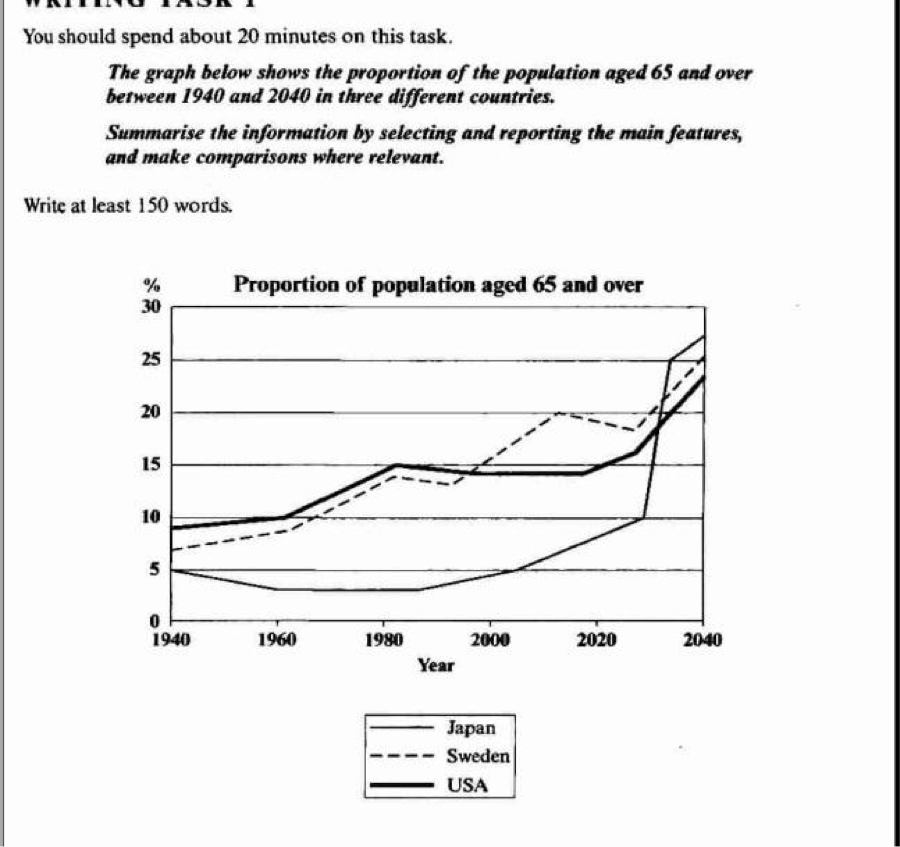
The graph illustrates the differences in the ageing population of Japan, Sweden, and the USA from 1940 to 2040.
Generally, it can be seen from the line graph that the percentage of people aged 65 or over has grown tremendously in all three countries over the period given. More over, while the USA had the highest proportion of the elderly at the beginning, Japanese is expected to have the largest ageing population in 20140.
In 1940, the proportion of those aged 65 or more in the USA was just under 10%, which doubled that in Japan and was 2% higher than that in Sweden. Afterwards, Sweden and the USA experienced similar upward trends, climbing to 14% and 15 % respectively in 1990. Meanwhile, after a slight decrease in 1960, Japanese ageing population stabilized at merely 3% until 1990.
For the rest of the period, although remaining much lower than those of the other two nations during the 1990- 2020 period, the proportion of people aged 65 or over in Japan is predicted to witness a dramatic surge to 27% in 2040. As for Sweden and the USA, the prediction is that figures will be around 25% at the end.
Top answer
The graph illustrates the differences in percentage s of the ageing population (65 and older) of Japan, Sweden, and the USA from 1940 to 2040. Generally, it can be seen from the line graph that the percentage of people aged 65 or over has grown tremendously in all three countries over and is anticipated to continue growing for the remainder of the period given. Mor eo ver, while the USA had the highest proportion of the elderly people at the beginning, Japa n ese is expected to have the largest ageing population in be leading in that regard by 2 04 0.
- The graph illustrates the differences in percentage s of the ageing population (65 and older) of Japan, Sweden, and the USA from 1940 to 2040.
- Generally, it can be seen from the line graph that the percentage of people aged 65 or over has grown tremendously in all three countries over and is anticipated to continue growing for the remainder of the period given.
- Mor eo ver, while the USA had the highest proportion of the elderly people at the beginning, Japa n ese is expected to have the largest ageing population in be leading in that regard by 2 04 0.
- In 1940, the proportion of those aged 65 or more in the USA was just under 10%, which doub le that in Japa n, and was 2% higher than that in Sweden.
- Afterwards, Sweden and the USA experienced similar upward trends, climbing to 14% and 15 % respectively in 19 8 0.
Get the Weekly English Kit 📬
New words, one handy idiom, and a 2-minute quiz — delivered to your inbox to keep your streak alive.
The graph illustrates the differences in percentages of the ageing population (65 and older) of Japan, Sweden, and the USA from 1940 to 2040.
Generally, it can be seen from the line graph that the pe
 Related Questions